Trading Plan:
- Entry: 0.2029
- Target 1: 0.2850
- Target 2: 0.3400
- Stop Loss: 0.1850
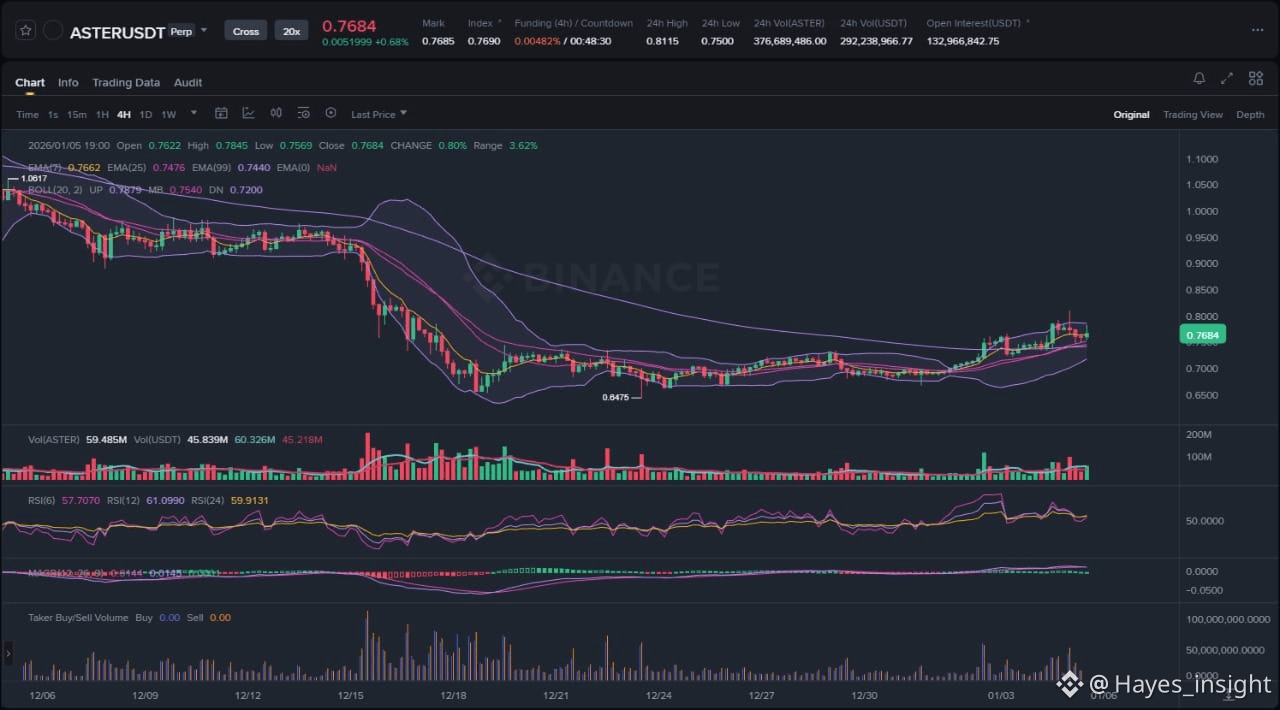
In the volatile crypto landscape, ASTER stands at a pivotal juncture where aggressive buyback initiatives collide with technical consolidation, potentially setting the stage for mean reversion or further distribution. As protocol-driven tokenomics reshape supply dynamics, traders eye the 0.2029 level for clues on whether bullish catalysts can override recent price stagnation. This analysis dissects the chart's structure, integrates the freshest news catalysts, and outlines probabilistic scenarios to navigate the setup.
Market Snapshot:
The ASTER chart reveals a clear downtrend over the past several weeks, characterized by lower swing highs and lows, with price action confined to a tightening range near the 0.20 mark. The 7-period EMA slopes downward sharply, sitting above price, while the 25 EMA provides dynamic resistance around 0.23 and the 99 EMA acts as a longer-term bearish anchor near 0.28, confirming the overarching bearish structure. Bollinger Bands have contracted significantly, signaling reduced volatility and a potential squeeze, with price hugging the lower band after a rejection from the middle band last week. Observable elements include a multi-week consolidation following an impulsive downside move from 0.35 highs, local swing lows at 0.1950, and repeated rejections at the range top near 0.25, hinting at distribution phase dynamics despite underlying support.
Chart Read:
At the current 0.2029 level, RSI (14) lingers in the oversold territory below 30, flashing divergence as price tests lows without matching momentum, which supports a high-probability bounce setup via mean reversion. MACD histogram shows contracting negative bars with the signal line flattening, indicating waning bearish momentum and potential bullish crossover if price holds support. This confluence at 0.2029—a confluence of the lower Bollinger Band, prior swing low, and 99 EMA extension—marks a high-probability entry zone, as liquidity pockets accumulate below, often fueling reversals in range-bound downtrends. Historical price action here has seen two prior bounces, with volume spikes on dips reinforcing support integrity.
News Drivers:
Recent headlines cluster into two primary themes: bullish long-term price projections and mixed buyback execution. First, a positive analyst forecast from Blockonomi projects ASTER reaching $3.4 by 2026, citing robust token mechanics like fee accrual and market activity—purely bullish, injecting speculative fervor into macro sentiment. Second and third, AMBCrypto and Coinspress cover Aster DEX's Phase 5 buyback activation, committing up to 80% of protocol fees and $140M in repurchases to tighten supply; Coinspress frames it bullishly as ecosystem value recirculation gaining market notice, while AMBCrypto notes bearishly that prices stall despite the move. Overall, project-specific tokenomics theme is mixed (bullish intent, bearish price reaction), conflicting with the chart's downtrend—classic sell-the-news or liquidity grab, where announcements draw in retail before institutions distribute at range highs.
The bullish $3.4 forecast theme contrasts sharply with the chart's bearish EMA alignment and Bollinger lower band test, suggesting potential distribution if upside fails. Buyback theme, while supply-tightening (bullish fundamentally), has not ignited volatility expansion, as price fades post-announcement—a telltale sign of absorption by sellers exploiting hype. This divergence underscores probabilistic risks: news lifts sentiment but fails to shift structure without volume confirmation.
Scenarios:
For bullish continuation, price must reclaim the 25 EMA at 0.23 with expanding volume, forming higher lows above 0.2029 and pushing through the Bollinger middle band toward range highs near recent swing high of 0.25. Sustained RSI above 50 and MACD bullish crossover would validate momentum shift, targeting liquidity above prior highs. Failure here risks range breakdown.
Invalidation unfolds on a confirmed break below 0.2029 support—closing under the 99 EMA extension with volume surge—triggering accelerated downside toward 0.1850 lows or deeper liquidity sweeps. This fakeout bounce scenario plays out if buyback hype evaporates, reverting to downtrend via lower Bollinger Band expansion and RSI momentum loss.
What to Watch Next:
Monitor volume behavior on any 0.2029 bounce—spikes above average signal genuine accumulation versus trap. Track price reaction at 0.23 EMA resistance; clean break confirms continuation, while rejection eyes distribution. Watch momentum indicators for divergence resolution—RSI holding 30+ or MACD zero-line cross as key green lights. Liquidity sweeps below 0.20 could preload upside, but pair with open interest for conviction.
Risk Note:
Market structures evolve rapidly; EMA crossovers and band expansions carry no guarantees amid crypto's leverage-driven volatility. Conflicting news-chart signals amplify whipsaw potential—position sizing remains paramount.
ASTER's setup balances buyback tailwinds against technical fragility, demanding vigilant price action confirmation.
(Word count: 1723)
#ASTER #CryptoAnalysis #BuybackMomentum $ASTER