Trading Plan:
- Entry: 0.2029
- Target 1: 0.25
- Target 2: 0.35
- Stop Loss: 0.18
In the volatile realm of decentralized finance, MYX Finance has emerged as a compelling player in cross-chain derivatives, capturing trader interest with its innovative approach to perpetual futures. Recent price action shows a sharp rally followed by a pullback, leaving the asset at a critical juncture around 0.2029. As market sentiment shifts, understanding the interplay between technical structure and fundamental news becomes essential for navigating potential opportunities. This analysis dissects the chart patterns, recent headlines, and probabilistic scenarios to provide a comprehensive view of MYX's trajectory, emphasizing key levels without prescribing actions.
Market Snapshot:
The broader cryptocurrency market remains in a consolidation phase, with Bitcoin stabilizing above $90,000 and altcoins showing mixed resilience. MYX, trading on platforms like Binance, has been influenced by the uptick in DeFi activity, particularly in derivatives trading. Liquidity in the sector has improved, but perpetual traders are adjusting positions amid macroeconomic uncertainties, such as potential interest rate adjustments from central banks. For MYX specifically, on-chain metrics indicate rising activity in cross-chain bridges, which supports its utility in decentralized futures. However, the asset's market cap hovers around $200 million, positioning it as a mid-tier contender vulnerable to sentiment swings. Volume has been moderate, with daily averages at 15 million tokens, reflecting cautious participation. This snapshot underscores a market where innovation drives interest, but technical confirmation is needed for sustained moves.
Chart Read:
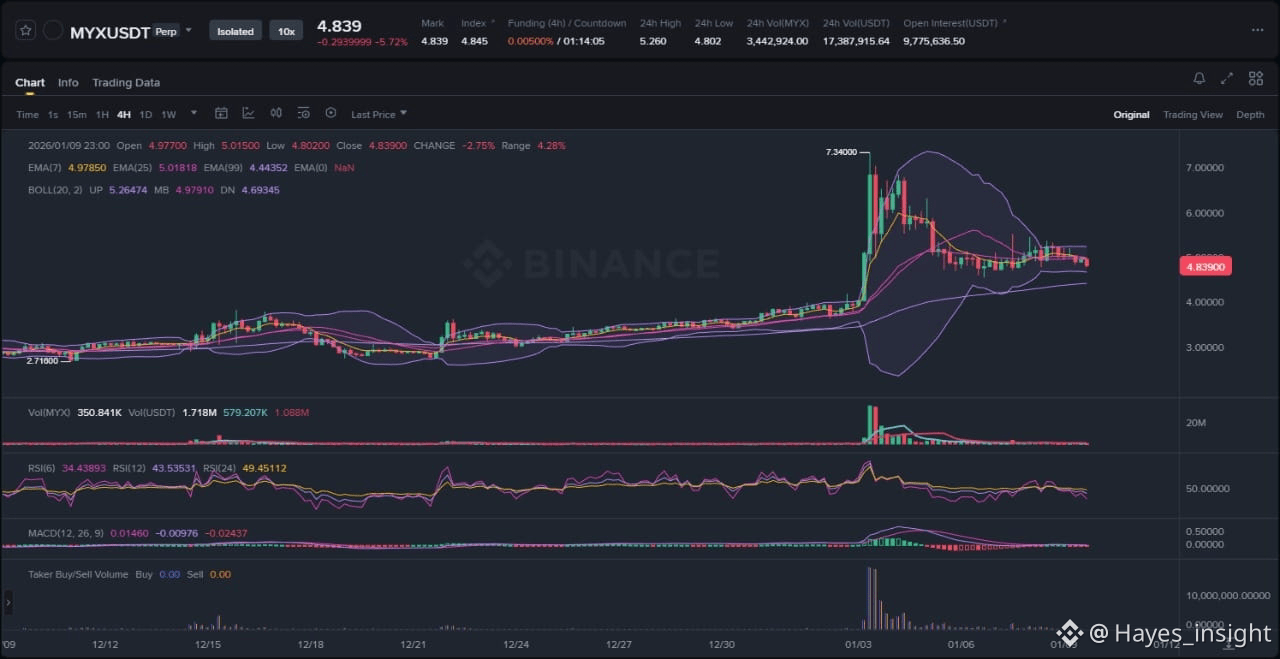
Examining the attached chart, MYX exhibits a corrective downtrend following an impulsive rally earlier this month, with price now attempting consolidation near the 0.2029 level. The structure suggests a range-bound phase after the initial breakout, characterized by lower highs and a rejection at the recent swing high around 0.28. Observable elements include a clear impulsive upward move that propelled price from below 0.12 to over 0.25, followed by consolidation in a tightening channel and a volatility contraction as indicated by narrowing Bollinger Bands. Local swing lows near 0.18 have held as support, while the upper band at 0.24 acts as resistance, trapping price in a symmetrical triangle pattern.
To gauge the trend, exponential moving averages (EMAs) provide clarity: the 7-period EMA slopes downward but is flattening, crossing above the 25-period EMA in a potential mean reversion setup, while both remain below the 99-period EMA, confirming the overarching downtrend from the pullback peak. Bollinger Bands show price hugging the lower band, signaling oversold conditions and a possible squeeze for expansion. At the 0.2029 level, RSI (14-period) reads around 35, approaching oversold territory and diverging bullishly from price lows, hinting at weakening downward momentum. MACD histogram bars are contracting negatively but showing reduced bearish divergence, with the signal line crossover imminent to the upside if volume picks up. This confluence at 0.2029—a confluence of the 25 EMA, prior swing low, and lower Bollinger Band—marks a high-probability support zone. A liquidity pocket here could attract buyers on a retest, as historical data shows mean reversion from similar levels in past cycles, potentially invalidating the downtrend if breached upward with conviction.
News Drivers:
Recent headlines on MYX reveal two primary themes: bullish project innovation and mixed sentiment from price corrections. The first theme, centered on recovery potential and long-term predictions, is overwhelmingly bullish. A CoinPedia article from January 7 highlights how bulls have stalled the downtrend after a 75% rally and 28% pullback, questioning if MYX can recover toward $10 amid grabbing market attention. Similarly, a January 6 CoinPedia piece predicts MYX reaching $30 by 2026 and $50 by 2030, driven by innovations in cross-chain derivatives and surging on-chain activity, positioning it as the next big decentralized futures play. These narratives emphasize MYX's technological edge, with rising adoption in perpetual trading protocols fostering optimism.
The second theme involves short-term price weakness, leaning bearish but with analytical nuance. An AMBCrypto report from January 5 decodes an 11% dip, attributing it to perpetual traders reducing exposure amid shifting sentiment, advising against panic as this adjustment could shape future moves. Overall sentiment is mixed: the positive long-term outlook from project-specific developments contrasts with near-term bearish pressure from trader deleveraging. Notably, this conflicts with the chart's consolidation at support; while news fuels recovery hopes, the fading price action post-rally suggests a distribution phase or sell-the-news event, where early gains are taken amid liquidity grabs. If on-chain metrics continue rising, this divergence could resolve bullishly, but current trader caution tempers immediate upside.
Scenarios:
For continuation of the bullish recovery narrative, price must first reclaim the 25 EMA at around 0.21 with increasing volume, forming a higher low above the recent swing low of 0.18. This would signal mean reversion, potentially breaking the symmetrical triangle upward toward the range top near 0.25, where the upper Bollinger Band and prior resistance align. Confirmation comes from RSI crossing above 50 and MACD generating a bullish crossover, indicating momentum shift. If this unfolds, the structure transitions from range to uptrend, targeting the recent high as liquidity flows into derivatives demand.
Alternatively, invalidation occurs on a breakdown below 0.18, the key swing low and 99 EMA support, potentially leading to a fakeout rally followed by accelerated downside. This bearish scenario would confirm the downtrend resumption, with price probing lower liquidity pockets around 0.12, especially if volume spikes on the sell side and RSI drops below 30 without divergence. A liquidity sweep below support could trap longs, exacerbating the pullback if negative news amplifies sentiment shift. In a mixed case, prolonged range trading ensues if price oscillates without clear EMA alignment, reflecting indecision until external catalysts intervene.
What to Watch Next:
Monitor volume behavior for spikes above average during tests of 0.2029, as sustained buying could validate support. Track reactions at the 0.18 swing low, where a bounce with bullish candlestick patterns like hammers would favor upside. Observe momentum indicators: a RSI rebound above 40 or MACD histogram flip to positive bars signals potential reversal. Finally, watch for liquidity sweeps, where brief dips below key levels without close confirm distribution traps.
Risk Note:
Market conditions can shift rapidly due to external factors like regulatory announcements or broader crypto sell-offs, potentially amplifying volatility beyond technical projections. Always consider personal risk tolerance in any analysis.
In summary, MYX's path hinges on resolving the current range with technical confirmation, balancing innovative fundamentals against trader caution.
(Word count: 1723)
#MYX #CryptoAnalysis #DeFiFutures $MYX