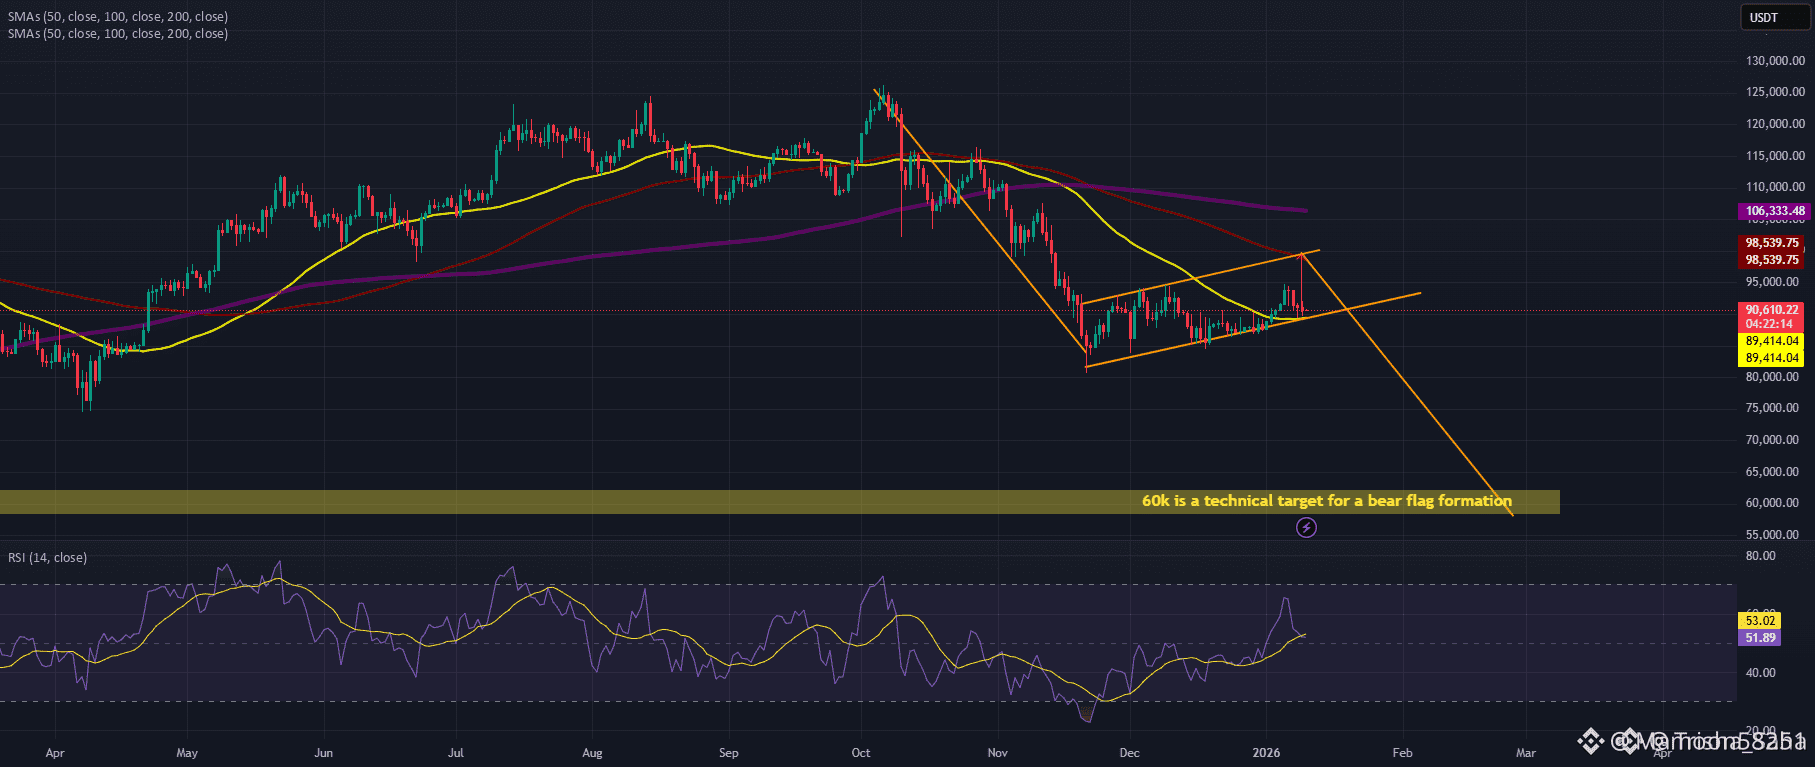
BTCUSDT is showing a clear bear flag structure on the daily chart after a strong bearish impulse. The aggressive sell-off was followed by a slow, upward consolidation, which typically signals a corrective pause rather than a genuine trend reversal.
In the near term, a temporary recovery is possible. Price could grind higher toward the $98,000 resistance area, where multiple technical factors converge, including key moving averages and the upper trendline of the bear flag. This region is likely to cap the upside, and any bearish reaction here would strengthen the case for further downside.
From a higher-timeframe perspective, the market bias remains decisively bearish. A confirmed breakdown below the bear flag would open the door for a continuation move toward the $60,000 region, which also aligns with a well-established historical demand zone.
Key Levels & Outlook:
Short-term move: Upside push toward ~$98,000
Chart pattern: Daily bear flag
Bearish confirmation: Rejection or breakdown from resistance
Invalidation: Strong daily close above the flag
Downside target: ~$60,000
This setup suggests waiting for confirmation at resistance rather than entering trades during the current consolidation.