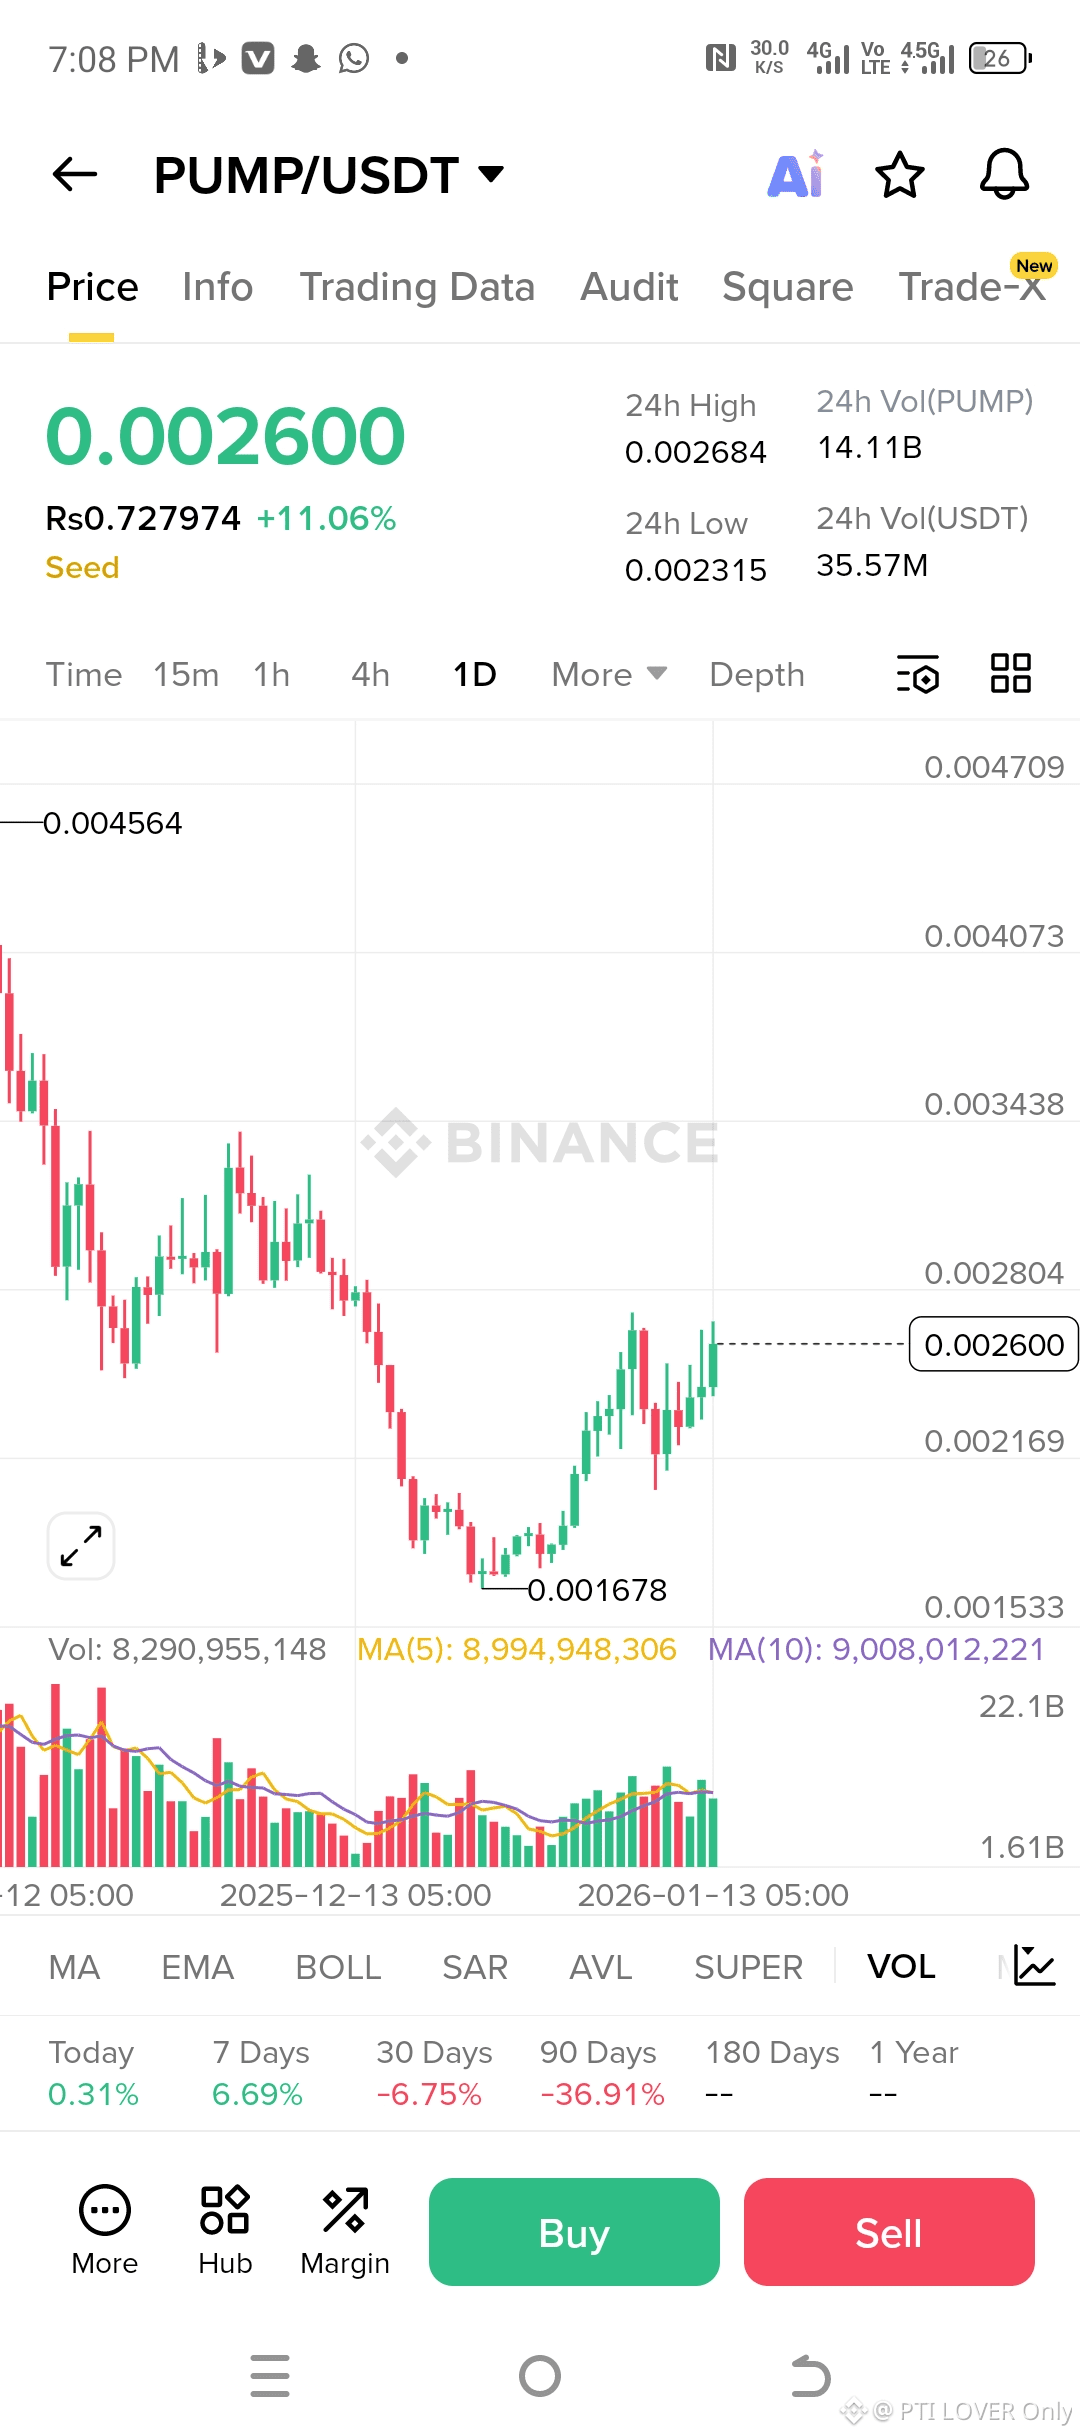
Market Structure (Daily Timeframe)
Current Price: ~0.00260
Trend: Short-term bullish pullback after a long downtrend
Key Low (Support): 0.00168 (strong bottom formed)
Price Action: Higher low + recovery → trend reversal attempt
🔑 Key Levels
🟢 Support Zones
0.00230 – 0.00220 (strong demand zone)
0.00195 – 0.00168 (major support, trend invalidation)
🔴 Resistance Zones
0.00280 – 0.00285 (first resistance)
0.00340
0.00405 – 0.00450 (major resistance from previous highs)
✅ Trade Plan (Low–Medium Risk)
🔹 Buy Setup (Best Area)
Buy Zone: 0.00230 – 0.00245
Wait for a pullback, don’t FOMO at resistance
Confirmation: Bullish candle / volume support on 4H or 1D
🛑 Stop Loss
SL: 0.00205
Conservative SL: below 0.00195
🎯 Take Profit Targets
TP1: 0.00280
TP2: 0.00340
TP3: 0.00400 – 0.00450
👉 At TP1, book partial profit and move SL to entry (break-even).
🚀 Breakout Trade (Aggressive)
If daily candle closes above 0.00285 with volume:
Buy on retest: 0.00280
Targets: 0.00340 → 0.00400
SL: 0.00255
📉 Bearish Scenario (Invalidation)
If price closes daily below 0.00195
Bullish setup fails
Expect move back toward 0.00168
📌 Risk Management
Risk max 1–2% of capital
Avoid over-leverage (especially for a Seed token)
Scale in, don’t go all-in