
Bitcoin (BTC) is showing renewed strength on January 14, 2026, surging to a local high of around $96,495 after breaking out from key resistance levels. The asset is currently trading near $95,000, marking a solid ~3% gain in recent sessions amid broader market optimism. This rally follows the release of softer-than-feared U.S. inflation data and signs of aggressive accumulation by large players, fueling speculation about a push toward higher target like $108K.
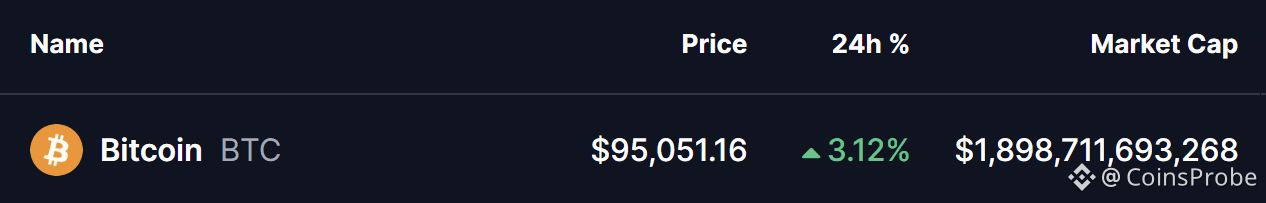 Source: Coinmarketcap
CPI Data Sparks Risk-On Sentiment
The U.S. Bureau of Labor Statistics released the December 2025 Consumer Price Index (CPI) on January 13, 2026. The headline CPI rose 0.3% month-over-month on a seasonally adjusted basis, with the 12-month increase at around 2.7% (in line with or cooler than some expectations amid ongoing tariff and economic pressures). Core CPI (excluding food and energy) climbed 0.2% monthly, up 2.6% year-over-year.
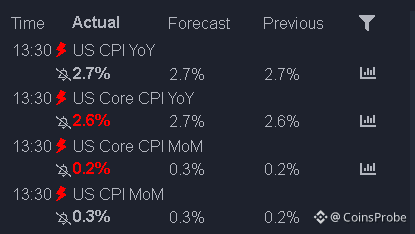 US CPI Data/Source: @camelfinance (X)
This print eased concerns about persistent inflation, boosting hopes for a dovish Federal Reserve stance in 2026 — potentially lower borrowing costs and more favorable conditions for risk assets like cryptocurrencies. The cooler data triggered a broad risk-on mood, with BTC benefiting alongside equities as investors rotated into higher-yield opportunities.
Heavy $BTC Accumulation:
On-chain metrics reveal aggressive buying by major exchanges and whales, creating significant supply pressure and supporting the upside momentum.Large players have been stacking BTC heavily:
Binance: ~27,371 BTC accumulated
Coinbase: ~22,892 BTC
Kraken: ~3,508 BTC
Bitfinex: ~3,000 BTC
Insiders and whales: ~14,188 BTC
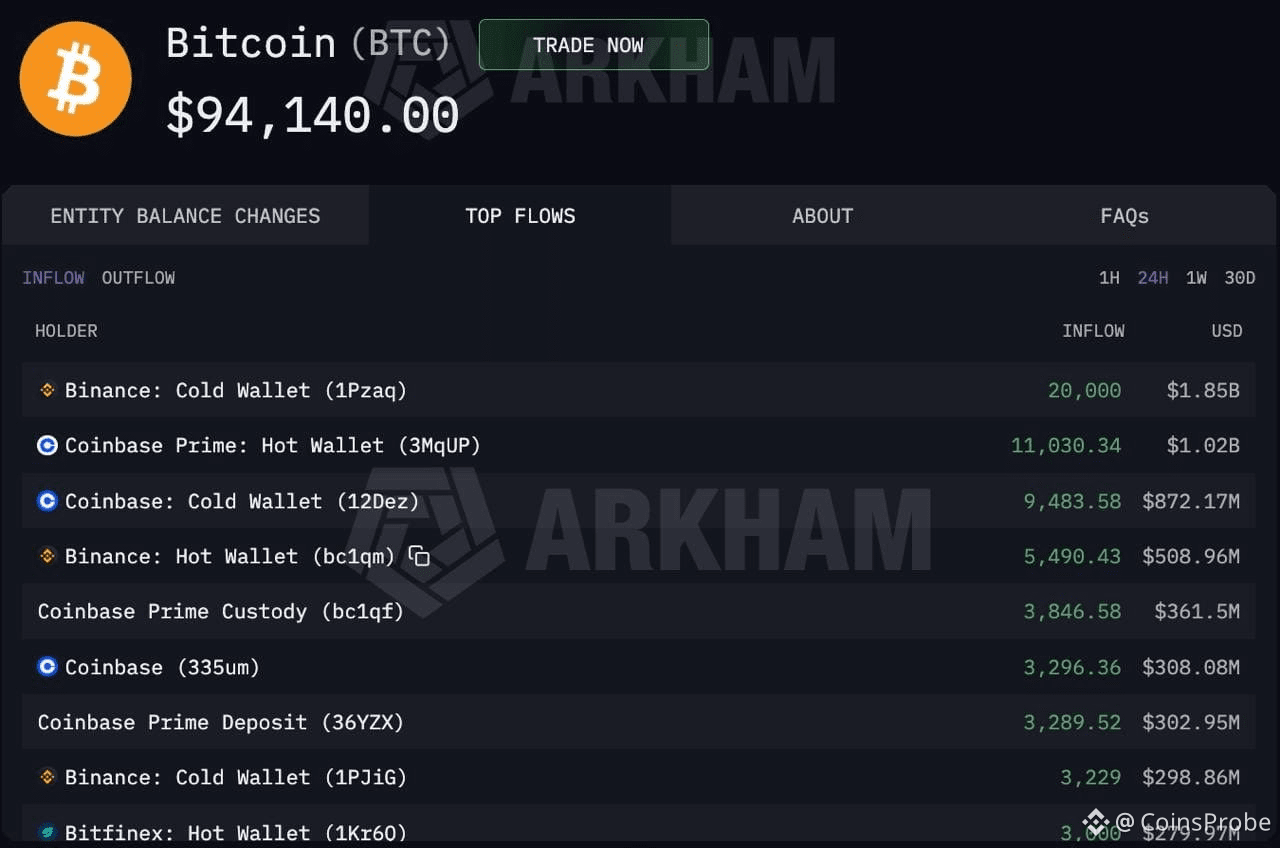 Source: @DeFiTracer (X)
In total, this represents nearly $6 billion worth of Bitcoin accumulated in recent periods, highlighting strong conviction from deep-pocketed participants such as institutions, exchanges (often holding on behalf of clients), and high-net-worth entities. This accumulation contrasts with spot Bitcoin ETFs, which recorded $870 million in inflows last week, providing steady downside support.
Technical Breakout in Bitcoin (BTC)
The daily chart shows Bitcoin breaking out of an ascending triangle pattern — a bullish continuation formation characterized by higher lows and a flat upper resistance.
The breakout occurred around $94,773, propelling $BTC to the recent local high of $96,418.
Price is now eyeing the 100-day moving average (MA) near $97,455 as the next immediate hurdle.
A potential retest of breakout levels (around the green consolidation zone) could provide healthy support before any further upside.
If momentum holds, the measured move from the ascending triangle projects toward the $108K target (dotted line on the chart).
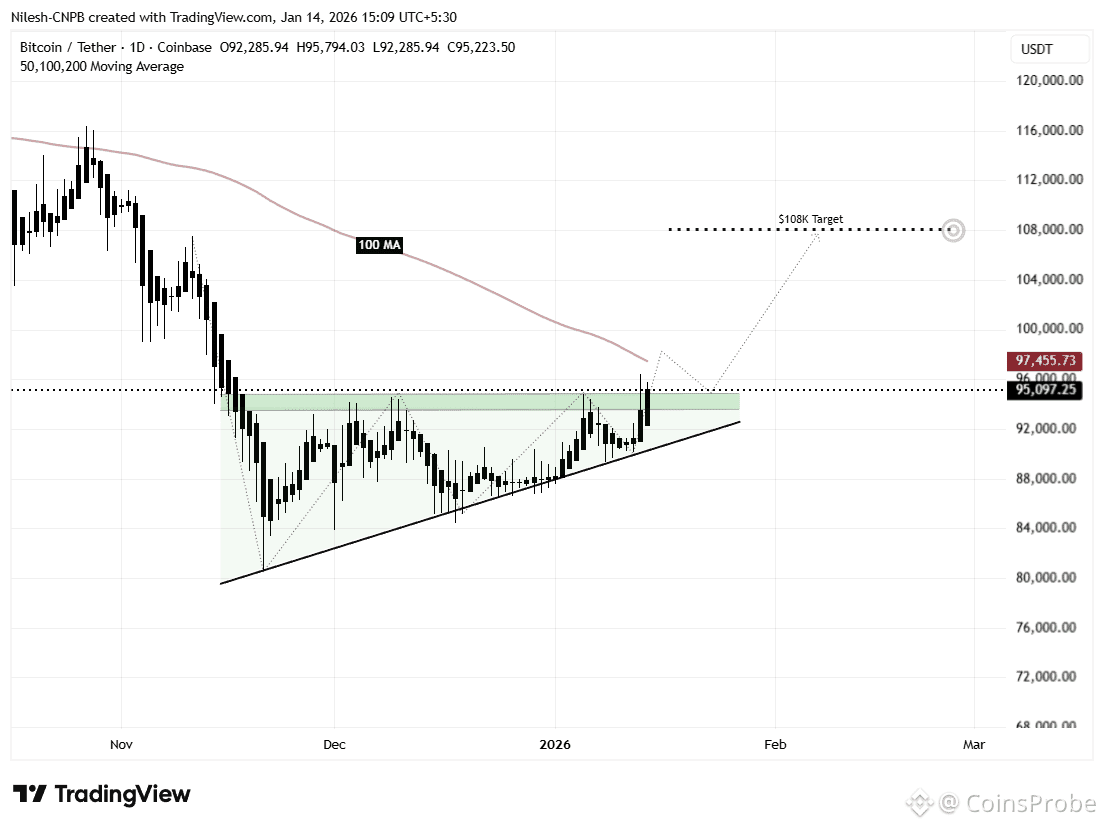 Bitcoin (BTC) Daily Chart/Coinsprobe (Source: Tradingview)
What’s Next for Bitcoin (BTC)?
This combination — macro relief from softer CPI, heavy on-chain accumulation, and a clean technical breakout — creates a compelling bullish narrative. A sustained hold above $95K–$97K could open the door to $100K+ psychological resistance first, with $108K as a realistic measured target in the coming weeks/months if catalysts align.
Disclaimer: The views and analysis presented in this article are for informational purposes only and reflect the author’s perspective, not financial advice. Technical patterns and indicators discussed are subject to market volatility and may or may not yield the anticipated results. Investors are advised to exercise caution, conduct independent research, and make decisions aligned with their individual risk tolerance.