

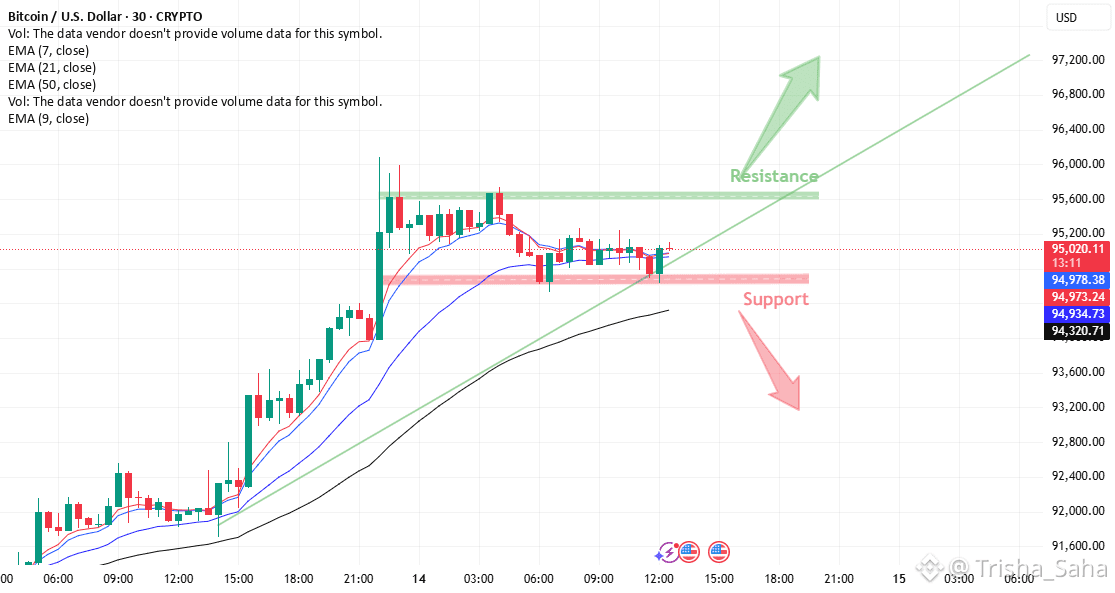
Bitcoin price action over a short-term timeframe (30-minute candles), with several Exponential Moving Averages (EMAs) plotted:
EMA 7 (fast)
EMA 9
EMA 21
EMA 50
There’s also a trendline, a support zone, and a resistance zone highlighted.
📈 Current Price Behavior
🔹 Trend Direction
The price is above the EMA 50, which signals overall bullish momentum.
Short EMAs (7, 9, 21) are tightly aligned and sloping upward — showing buyers are in control in the short term.
Conclusion: Trend is bullish on this timeframe.
🟩 Resistance Zone (~95,600–95,800)
This green shaded area is where price previously peaked and stalled:
➡ Sellers stepped in here before, pushing price back down.
So it acts as immediate resistance — if price breaks above it with momentum, buyers will likely push toward the next upside target.
📌 Resistance ~95,600–95,800
🟥 Support Zone (~94,700–94,900)
This pink/red shaded area represents a demand zone where price has bounced multiple times:
✔ Price has tested this area and held
✔ EMAs are converging above support
✔ Trendline also connects near this zone
So this is an important support level — if it breaks, price could shift into a deeper pullback.
📌 Support ~94,700–94,900
📊 Trendline Support
You’ve drawn a rising green trendline — this adds dynamic support:
As long as price stays above this line, the uptrend remains intact.
A break below could signal a loss of bullish short-term structure.
📌 Technical Scenarios
🟢 Bullish Continuation
If price:
Holds above support (~94,700–94,900)
Breaks above resistance (~95,600+)
Then the bullish path is likely:
➡ Upside continuation toward 96,000+, 96,500+
The green arrow on the chart reflects this scenario.
🔴 Bearish Rejection
If price:
Breaks below the support zone
Closes below the trendline
Then bears could drive the market lower:
➡ Target next support levels around ~94,000–93,500
This path is shown with the red arrow.
🧠 EMAs & Momentum Interpretation
Short EMAs above longer EMAs: bullish alignment
Flat to slightly rising EMAs: consolidation but still controlled by buyers
Price hugging EMAs near support: good area to watch for bounce
If price starts to significantly separate below EMAs, that could indicate loss of strength.
🧾 Summary — Simple Trading Read
Bullish bias (current):
✅ Price above key EMAs
✅ Support holds near ~94,700–94,900
✅ Trendline intact
Key Levels
Resistance: ~95,600–95,800
Support: ~94,700–94,900
Trendline support: rising just below current price
Watch for:
• A breakout above resistance → long continuation
• A breakdown below support/trendline → short-term pullback
