

Market Structure
Overall structure:
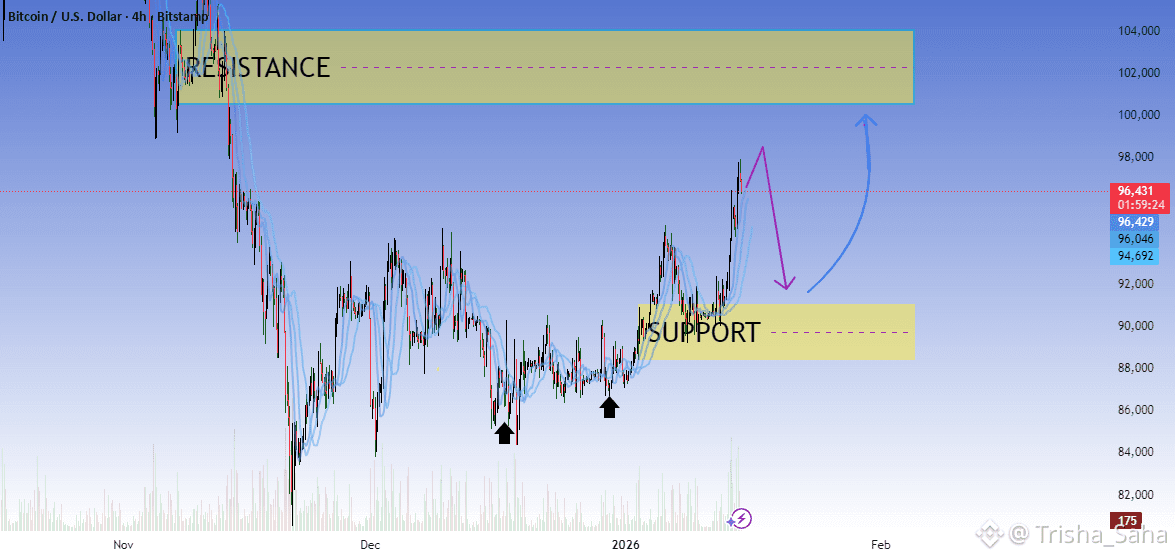
After a sharp sell-off from the prior highs (left side), Bitcoin has transitioned into a range / accumulation phase, then recently broke upward from consolidation.
The series of higher lows marked by the black arrows suggests bullish structure building since late December.
2. Key Zones
🔴 Resistance Zone (≈ 100k – 104k)
This is a major supply zone where price was aggressively rejected before.
Strong selling pressure previously entered here → expect:
First test = rejection likely
Multiple tests = higher chance of breakout
The dotted mid-line inside the zone is a reaction level, not a clean breakout area.
🟡 Support Zone (≈ 88k – 90k)
Former resistance → now acting as support (role reversal).
Price recently:
Broke above it
Pulled back
Held → bullish confirmation
This zone is critical for maintaining the bullish bias.
3. Current Price Action
Price pushed impulsively to ~96–97k (strong bullish momentum).
The purple path suggests a healthy pullback:
This would likely be a bullish retracement, not weakness.
As long as price holds above the support zone, the trend remains intact.
4. Likely Scenarios
✅ Bullish Continuation (Higher Probability)
Pullback into 90k–92k
Buyers step in (bullish candle / volume)
Push toward 100k+
Possible:
First rejection
Then consolidation
Break into resistance zone
📈 Target: 100k – 104k
⚠️ Bearish / Invalid Scenario
Clean 4H close below ~88k
Would indicate:
Failed breakout
Return to range
That could open downside toward 85k–82k
5. Momentum & Volatility Insight
The smooth blue curves indicate volatility compression → expansion.
Expansion happened upward → bias remains bullish until structure breaks.
Sharp moves followed by shallow pullbacks = trend strength, not exhaustion (yet).
6. Trading Takeaway (Not Financial Advice)
Bias: Bullish while above support
Best risk area: Support retest (90k zone)
Worst place to enter: Mid-range (95k–97k)
Key decision point: Reaction at 100k resistance
