Here is a clear Bitcoin ($BTC ) technical analysis in English, including trend, entry/exit zones, and scenarios:
🔹 Bitcoin (BTC) Technical Analysis
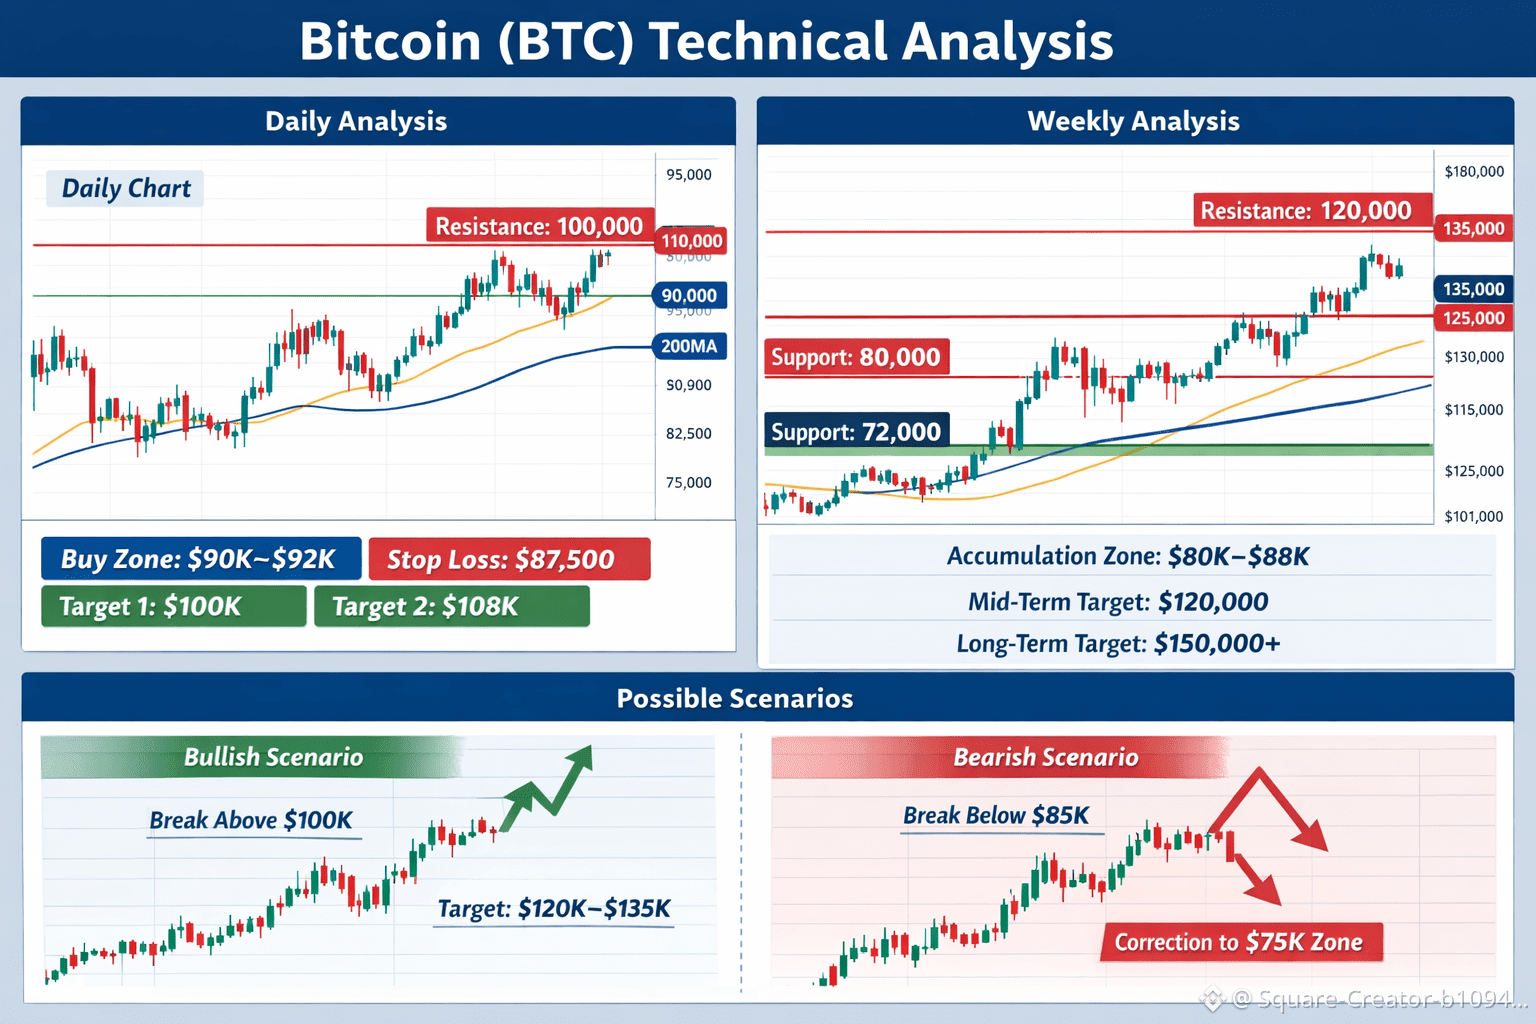
📊 Daily Timeframe
Trend: Medium-term bullish with normal pullbacks
Price is trading above the 50-day and 200-day moving averages → bullish strength
RSI is elevated but not showing strong bearish divergence
Key Support Levels:
90,000
85,000
Key Resistance Levels:
100,000 (major psychological resistance)
108,000
Daily Trade Setup:
Buy Zone: 90,000 – 92,000
Stop Loss: 87,500
Targets:
TP1: 100,000
TP2: 108,000
🔹 Weekly Timeframe
Trend: Strong long-term uptrend (Bull Market)
No confirmed reversal signals
Market structure remains higher highs and higher lows
Weekly Support:
80,000
72,000
Weekly Resistance:
120,000
135,000
Investment Strategy:
Accumulate between 80,000 – 88,000
Mid-term Target: 120,000
Long-term Target: 150,000+
🔹 Possible Scenarios
✅ Bullish Scenario
Strong breakout and daily close above 100,000
Momentum continuation toward 120K → 135K
⚠️ Bearish / Correction Scenario
Breakdown below 85,000
Deeper correction toward 75,000, considered a strong long-term buy zone
🔹 Summary
Scalping & Swing: Buy at support, sell near resistance
Investment: Overall trend remains bullish
Risk Management is critical due to high volatility