$BTC is trading below major psychological resistance near $95,000–$100,000.
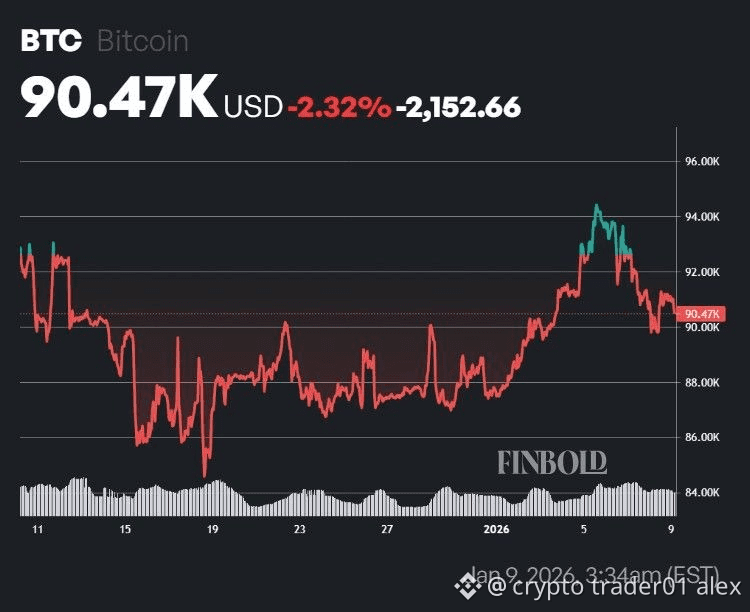
The market has been consolidating around $88,000–$94,000 over the past few weeks, showing indecision and low volatility.
Month-to-date data shows modest moves within this range, with no breakout yet.
Key technical levels (short-term):
Support: $88,000 (near recent lows).
Immediate resistance: $95,000.
Major psychological wall: $100,000.
A clean break above $95k/$100k with volume could signal a new bullish phase.
📊 Technical Signals & Patterns
Consolidation Phase:
BTC has lacked directional conviction, trading in a wide range (approx. $85k–$95k). This consolidation indicates the market is absorbing news and waiting for a catalyst before choosing a clear trend. Volume has been relatively subdued, supporting range-bound price behaviour.
Chart pattern implication:
Bullish scenario: Break above resistance (~$95k) → move toward $100k+ targets.
Bearish risk: A breach below $85k could target lower supports near $80k.
🧠 Market Drivers (Fundamental)
➤ Macro & Sentiment
Geopolitical headwinds and risk-off sentiment have weighed on BTC recently, causing slippage to around $91k.
Prior tariff threats and geopolitical stress contributed to continental crypto drawdowns.
➤ Regulatory & Institutional
Some bullish catalysts remain on horizon — potential clarity in U.S. regulations and ETF adoption can support upward momentum.
Institutional outlooks vary: Standard Chartered trimmed long-term forecasts while still calling for continued growth into 2026.
➤ Broader Risks
Industry analysts caution about long-term technological risks like quantum computing potentially impacting cryptographic safety (long horizon).
📅 Short-Term Price Forecasts
Some near-term model projections suggest:
A modest uptrend through late January if BTC sustains above current levels.
Breakout above resistance ~$96k could validate bullish momentum into early February.
Bear cases: If BTC closes below key support (~$85k), next downside target is ~$80k.
📍 Summary – What Traders Are Watching
Bullish cues
Holding above current consolidation (~$88k).
Break above $95k/$100k on volume.
Continued ETF flows and regulatory clarity.
Bearish cues
Failure to lift above resistance repeatedly.
Breakdown under key supports ~$85k–$80k.
Macro downcycles triggering risk-off flows.
2
