
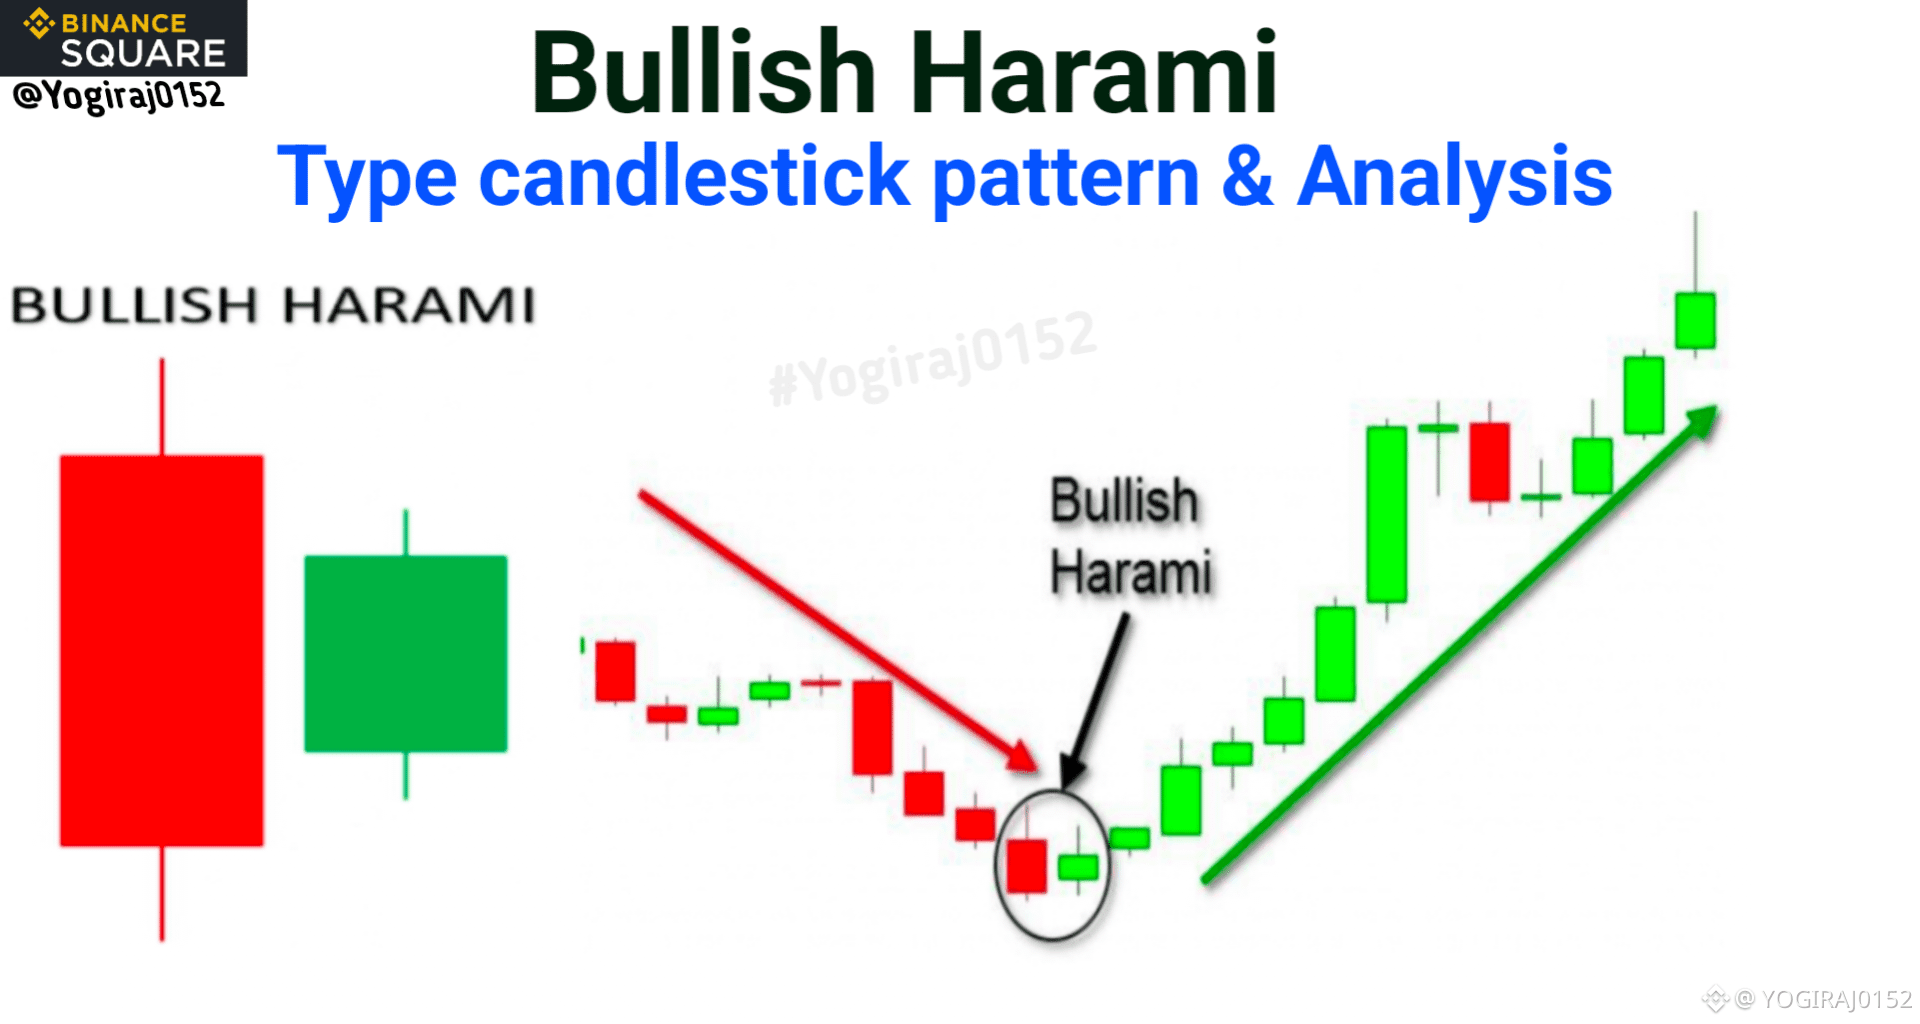
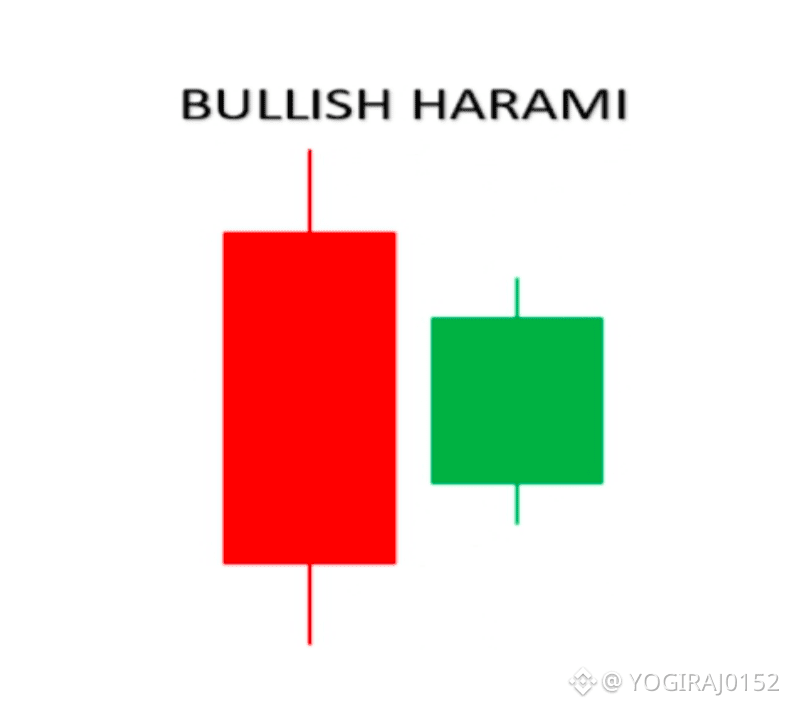
The first candle is a big candle, and the second candle is much smaller than the first candle, and the color of both the candles is different, HARAMI PATTERN is formed in both types of TREND.
UP TREND and DOWN TREND, if HARAMI PATTERN is formed in DOWNTREND in the chart then there is a possibility of TREND REVERSAL. BULLISH TREND in future.
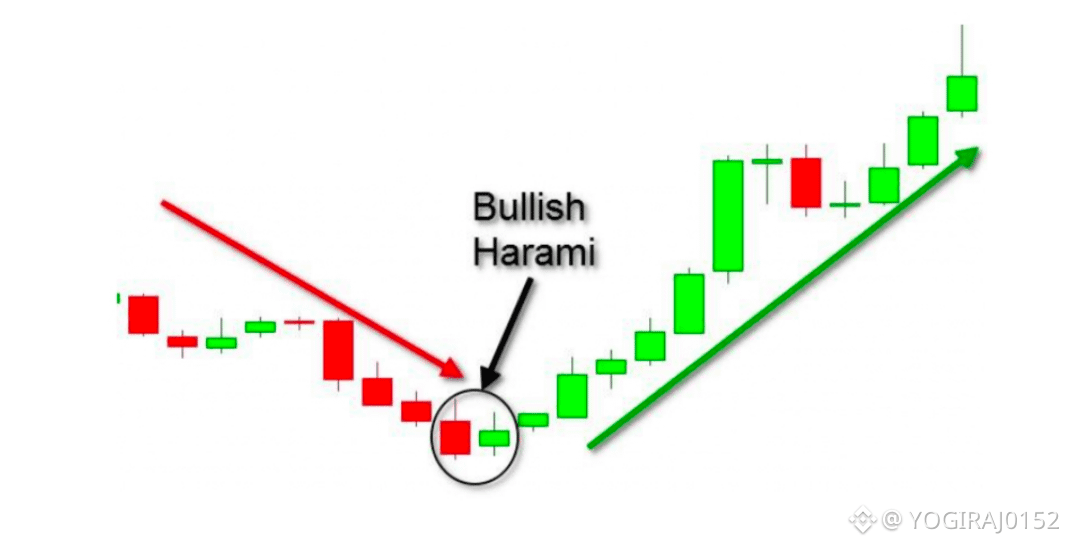
Bullish harami candle is a bullish candlestick pattern, that is, it shows bullishness, when this candle is formed then it shows that the bearish period in the stock is over and bullishness has started.


#Bullishharami #CandlestickPatterns #binancesquareofficial #Write2Earn #Yogiraj0152
👉🏻If you like👍🏻 the article, then like💛 and share, if you want to say something related to the article, then comment, we will definitely reply. ✅Follow us so that all our upcoming articles, posts, videos can reach you. If you have got some good information from our post then you can also give us tips. 😊Thank you for reading the post!🙏
⚠️ DISCLAIMER:
This post is for educational / informational purposes only. Nothing contained herein should be construed as financial advice, investment advice, or a recommendation. The crypto market is highly risky. Conduct your own research and consult a financial advisor before making any decisions. The author / page is not liable for any profits / losses.
"Act at your own risk.”