The market is showing some heavy red candles today, but for the disciplined trader, volatility is just another word for opportunity.
Let’s break down what the charts for $SUI, $ADA, and $XRP are telling us right now.
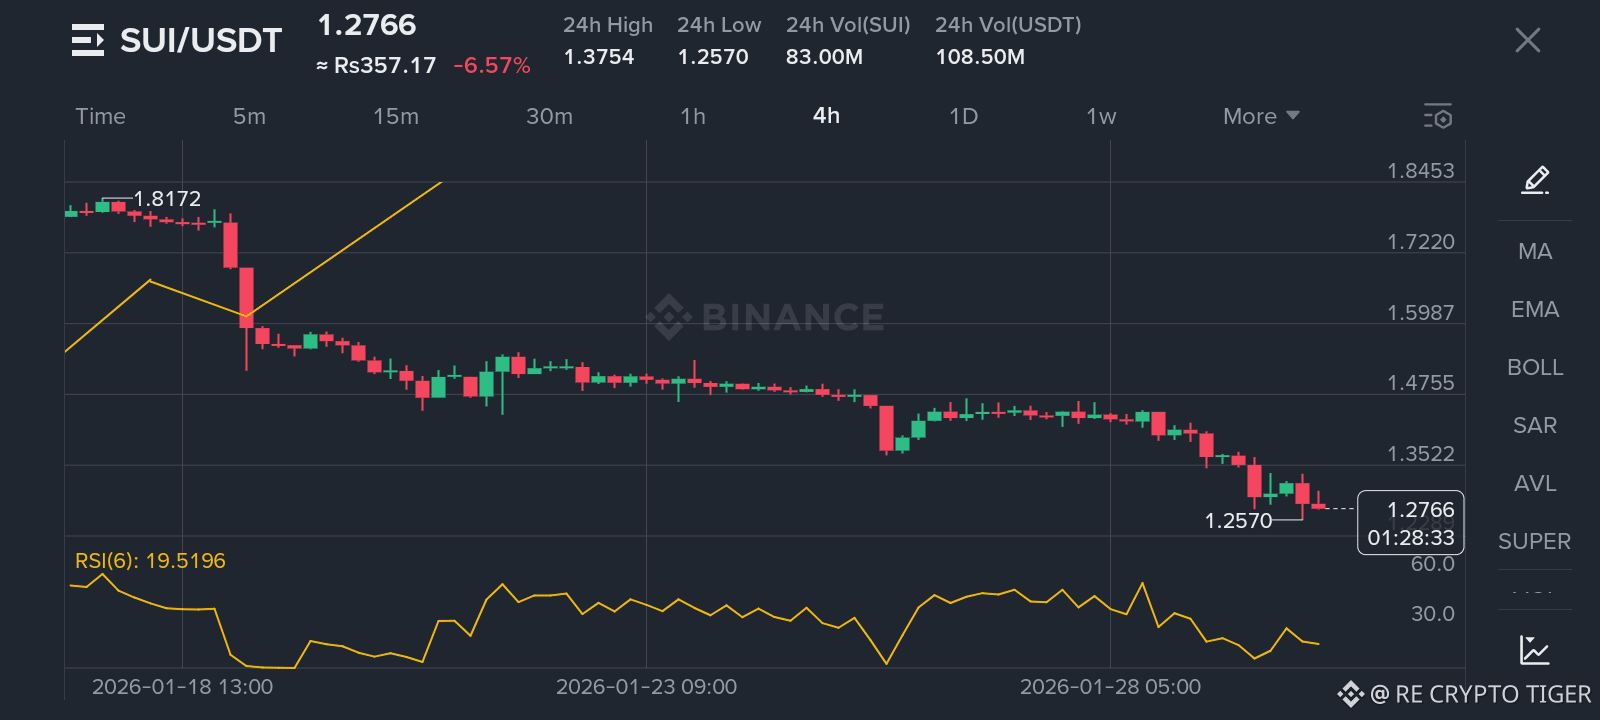
🌊 $SUI /USDT: Testing the Support
SUI is currently trading around $1.27, down roughly 6.5%.
The Chart: We’ve seen a consistent slide from the $1.81 peak.
RSI Check: The RSI (6) is sitting at 19.5, which is deep in the oversold territory.
Outlook: While the trend is bearish, an RSI this low often precedes a relief bounce. Keep a close eye on the $1.25 level for a potential double bottom or reversal signal.
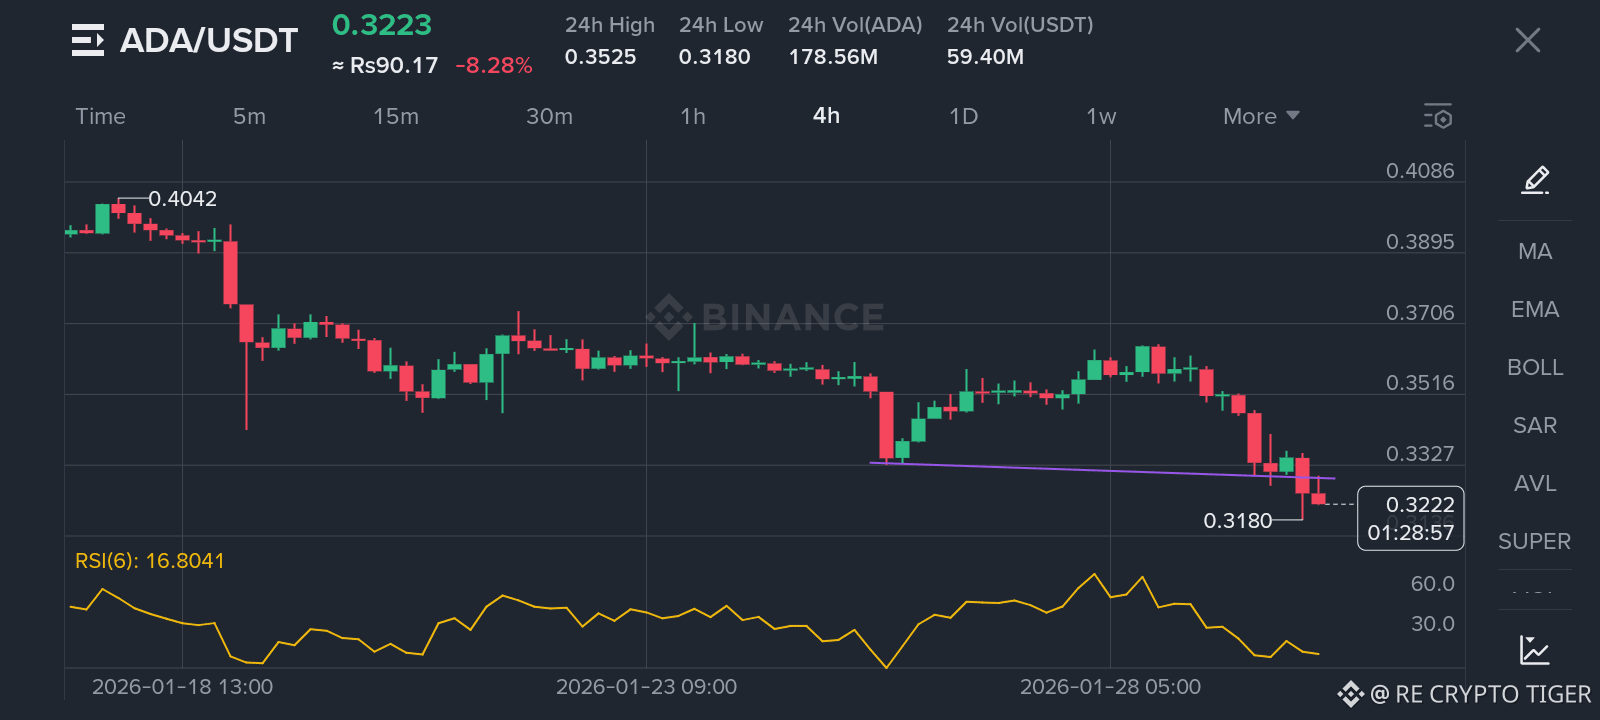
🛡️ $ADA /USDT: Looking for a Bounce
Cardano is feeling the pressure at $0.32, marking an 8.2% drop.
The Chart: ADA has broken below a minor support line (purple), searching for a new base.
RSI Check: With an RSI of 16.8, the selling pressure is reaching extreme levels.
Outlook: Historically, ADA doesn't stay in the "teens" on the RSI for long. A technical retracement toward $0.34 could be on the horizon if the broader market stabilizes.
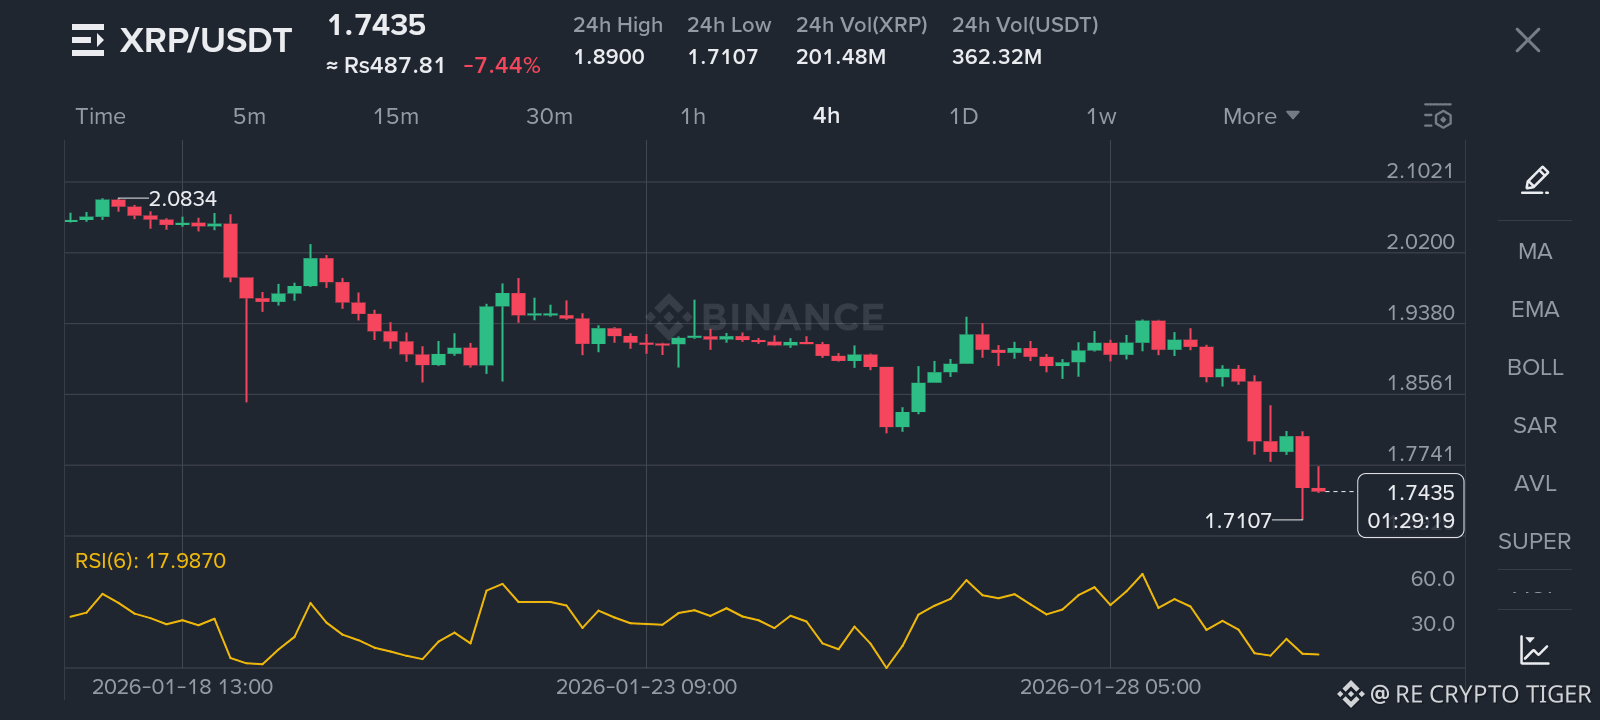
⚡ $XRP /USDT: Resilience at $1.71?
XRP is trading at $1.74, down about 7.4%.
The Chart: After a sharp drop from $2.08, it recently touched a 24h low of $1.71.
RSI Check: RSI stands at 17.9.
Outlook: XRP is showing a classic "oversold" signature. The $1.70 - $1.72 zone is a critical psychological support. If it holds, we might see a fast recovery toward the $1.85 resistance.
💡 Trader’s Takeaway
The "Extreme Fear" in the short-term RSI across all three assets suggests the "panic selling" phase may be nearing its limit.
Strategy: 1. DCA: Consider Dollar Cost Averaging if you believe in the long-term tech.
2. Patience: Wait for a green candle confirmation on the 4H chart before jumping in.
3. Risk Management: Always use Stop Losses in this volatility!
What's your move? Are you buying the dip or waiting for more clarity? Let me know in the comments! 👇
#crypto #Cardano #TechnicalAnalysis #Binance #TradingTips