In case you are looking at the charts at the moment and you feel bad, you are not alone. It is not just a brief trough, but an apparent violation of an old trend.
The messages contain a lot of panic. Let's cut through the noise. I will provide an account of what is currently occurring on the 1-hour chart, the reason the price has fallen, and how I am going to proceed over the next 24 hours.
Real-Time Chart Analysis (1-Hour View)
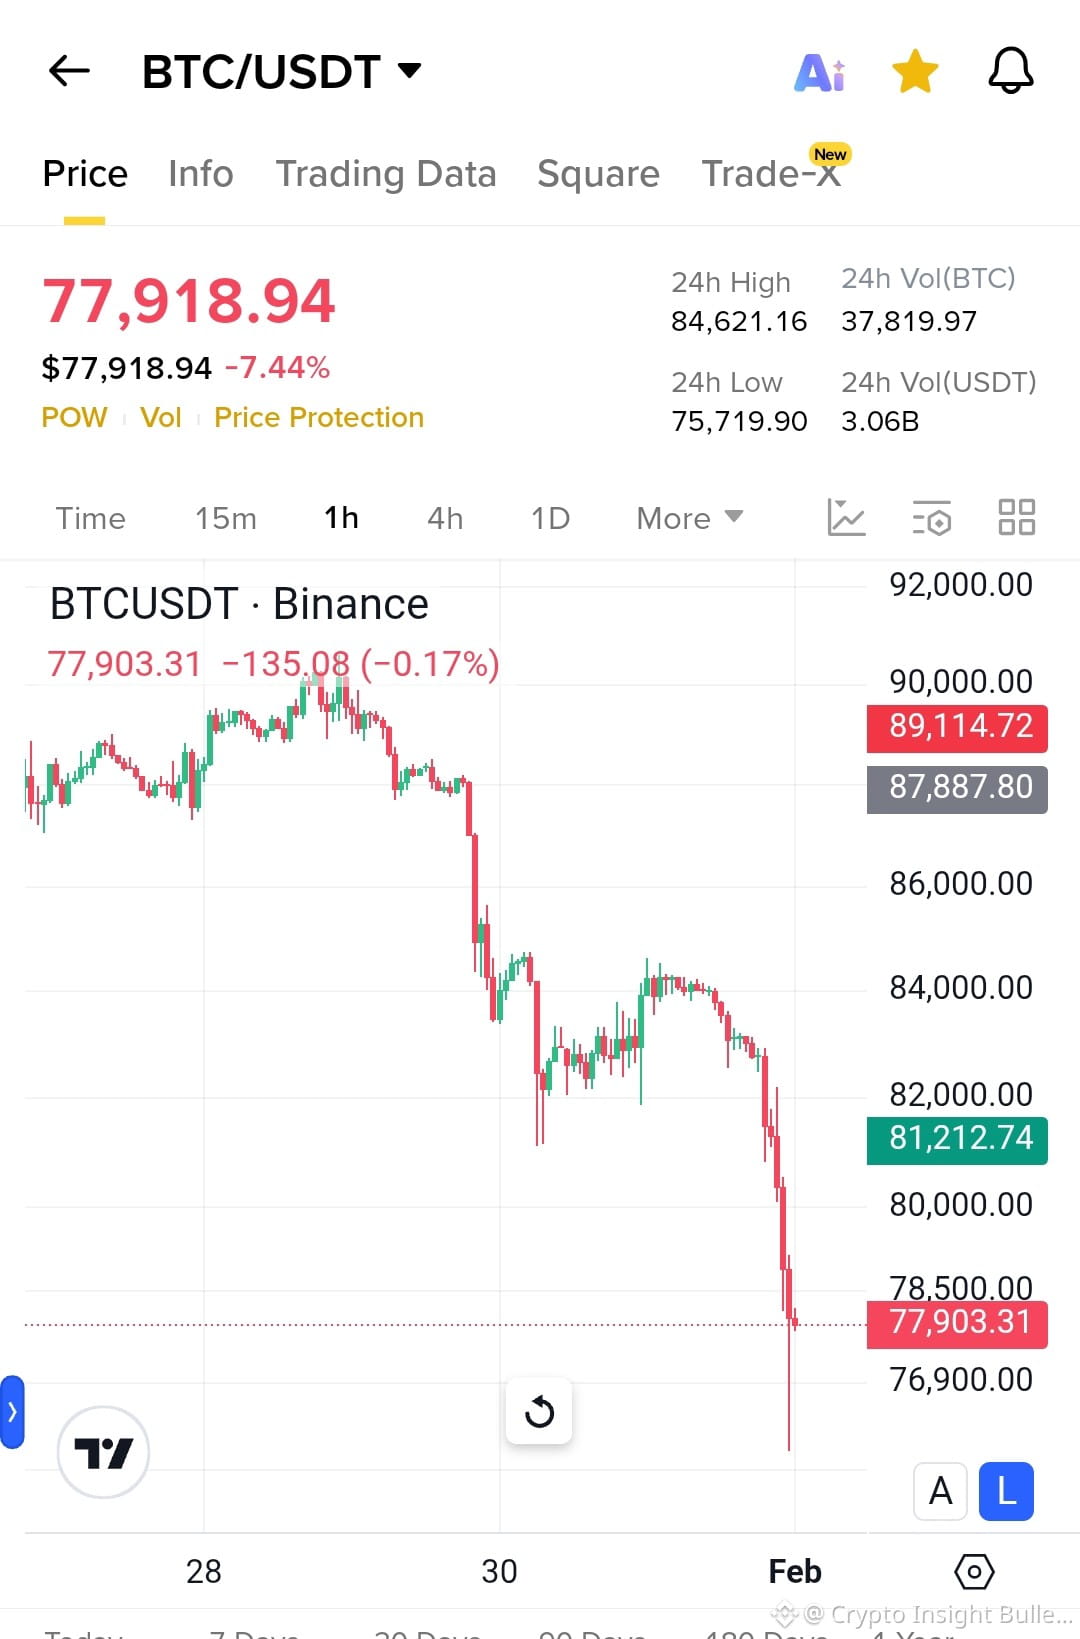
Current Price: ~$77,770
I am examining the 1-hour BTC/USD chart and, quite honestly it is a waterfall.
The Breakdown: We opened the day at approximately 84,100. The decline began at around 14: 00 (2:00 PM) when numerous selling activities drove the price down. The most critical point was that just several hours ago, the level of 80,000 that is quite an important support line and has been holding since the end of the 2025 was violated with barely any buyers revealed.
Candlestick Structure: The four or five hourly bars before it are solid red candles with no upper or lower shadows, called Marubozu candles. This is an indication that sellers dictate the market. Small bars are hardly present, and that is, buyers are not back.
Momentum (RSI): The 1-hour RSI is minimal, it is less than 20. Normally then it would imply the rebound is in sight but in quick log out such as this RSI can remain elevated as the price goes on decreasing.
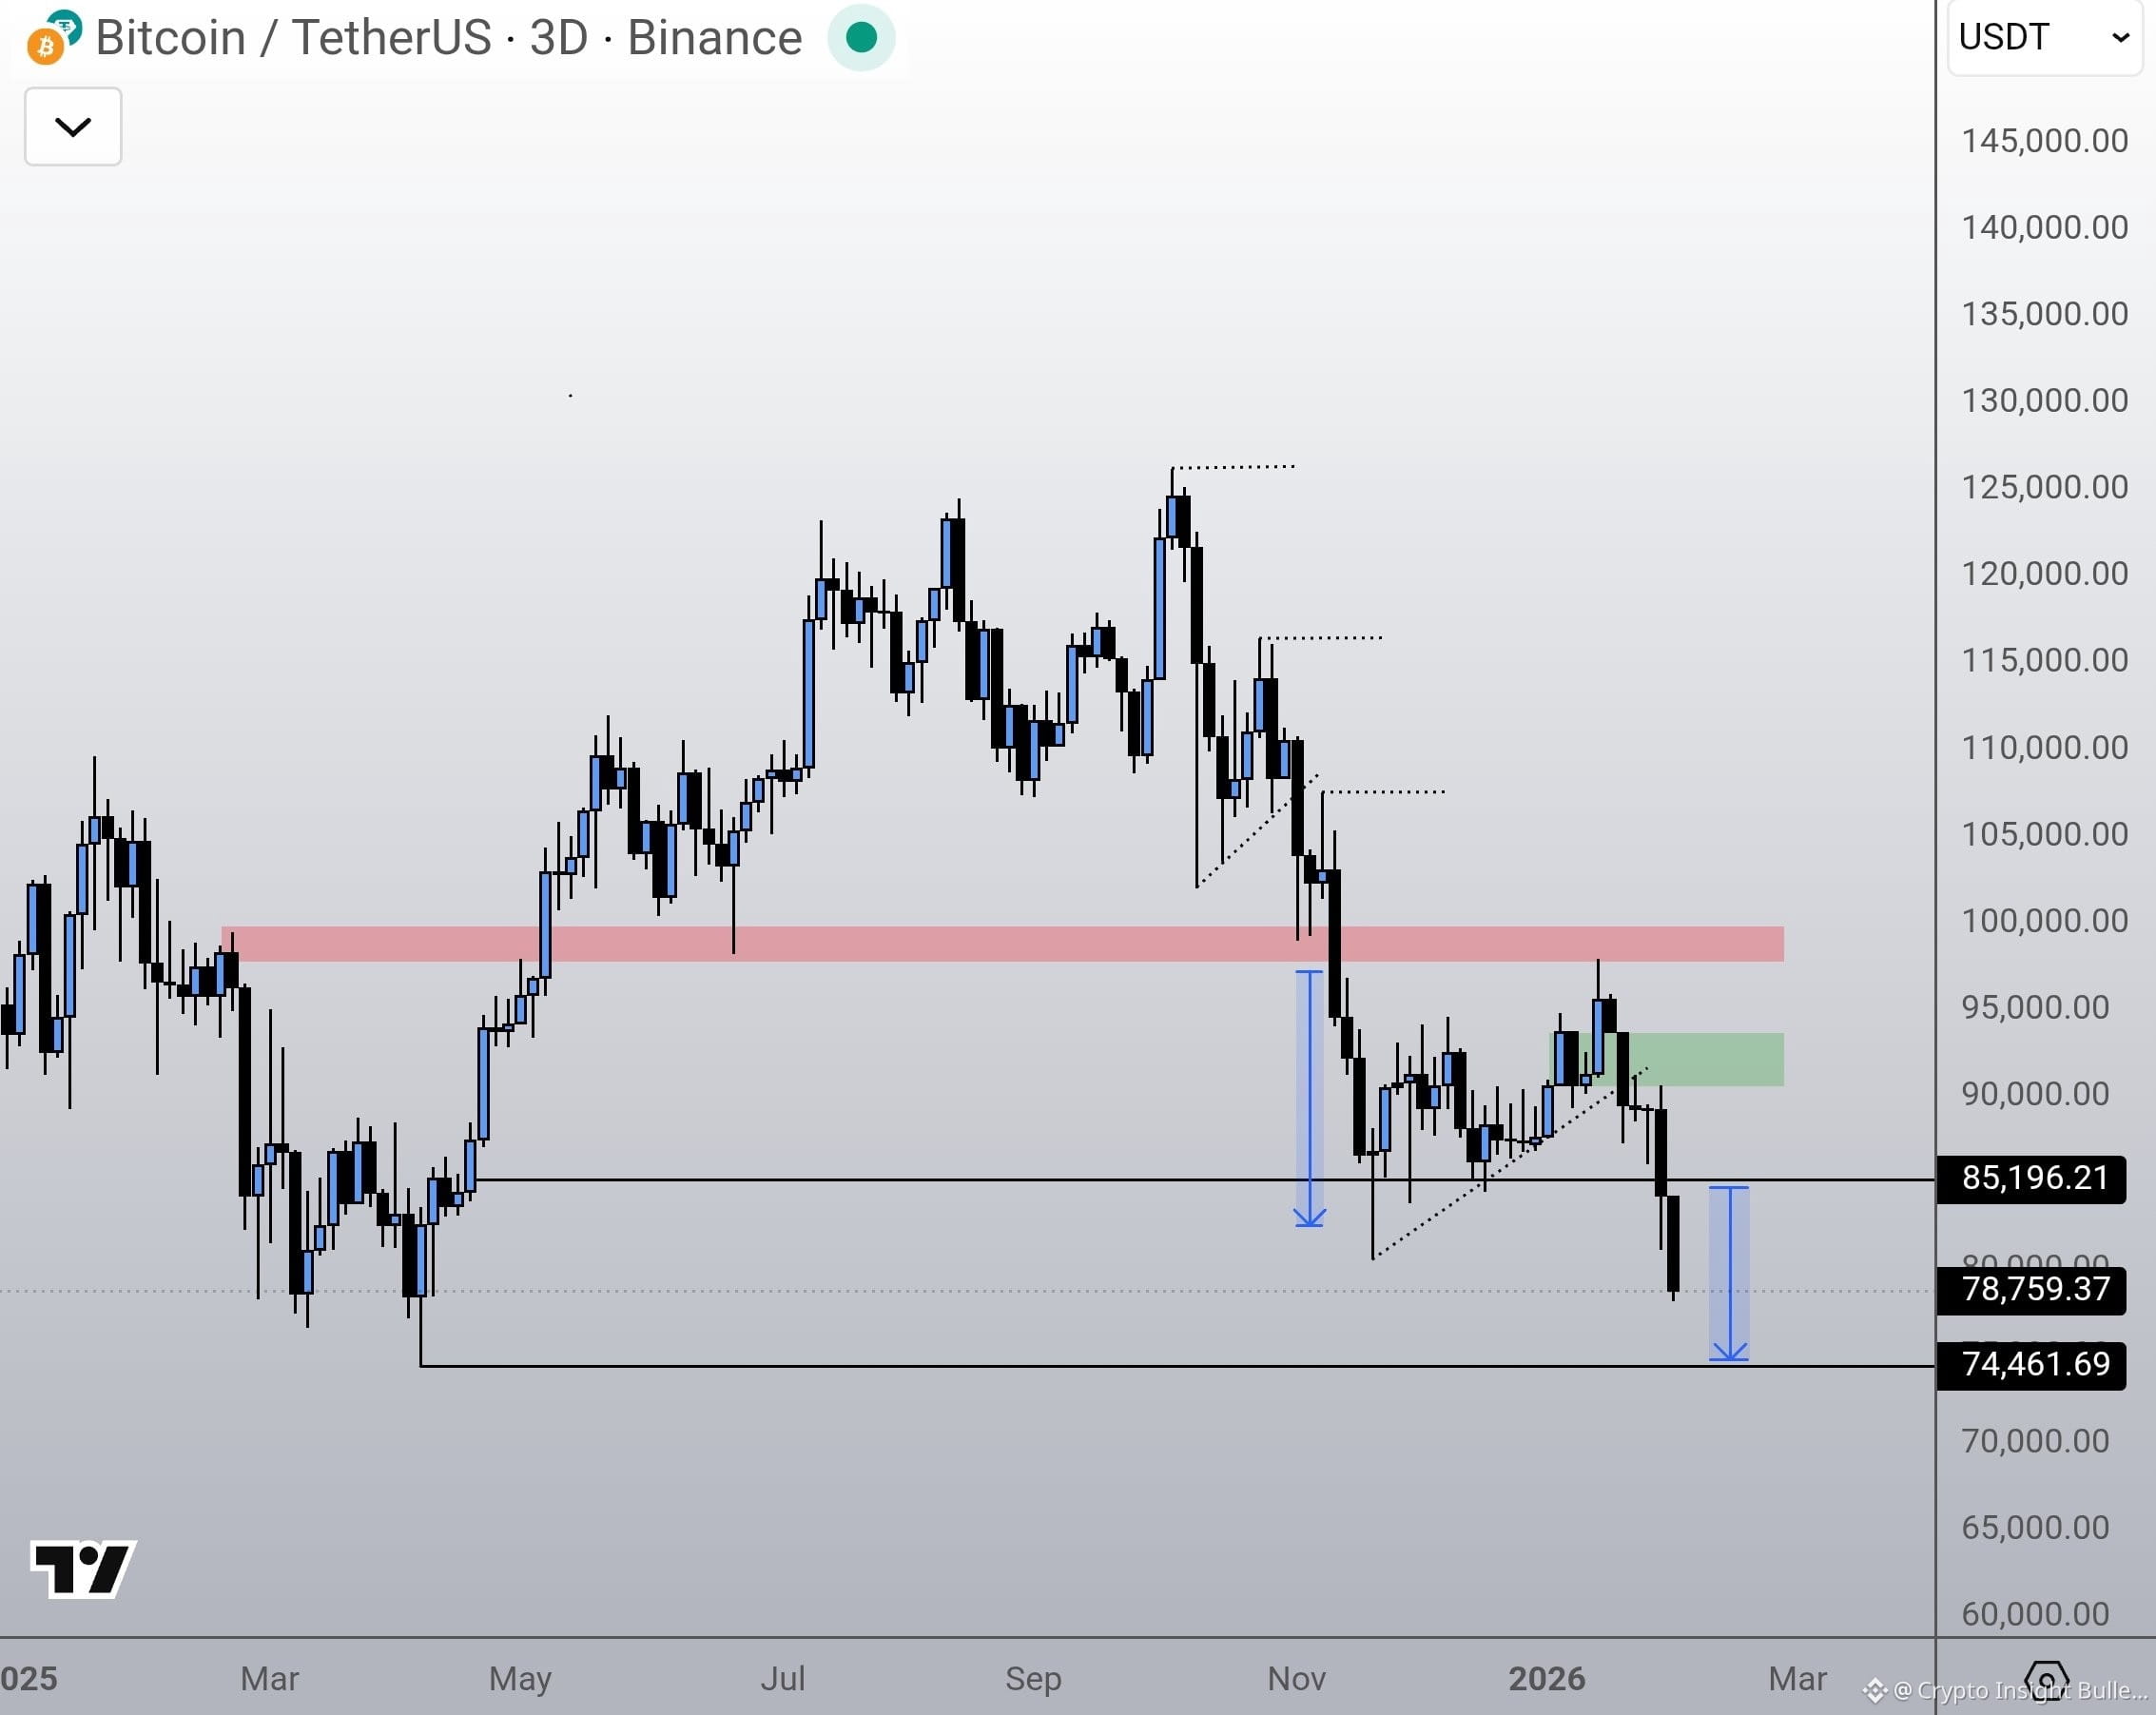
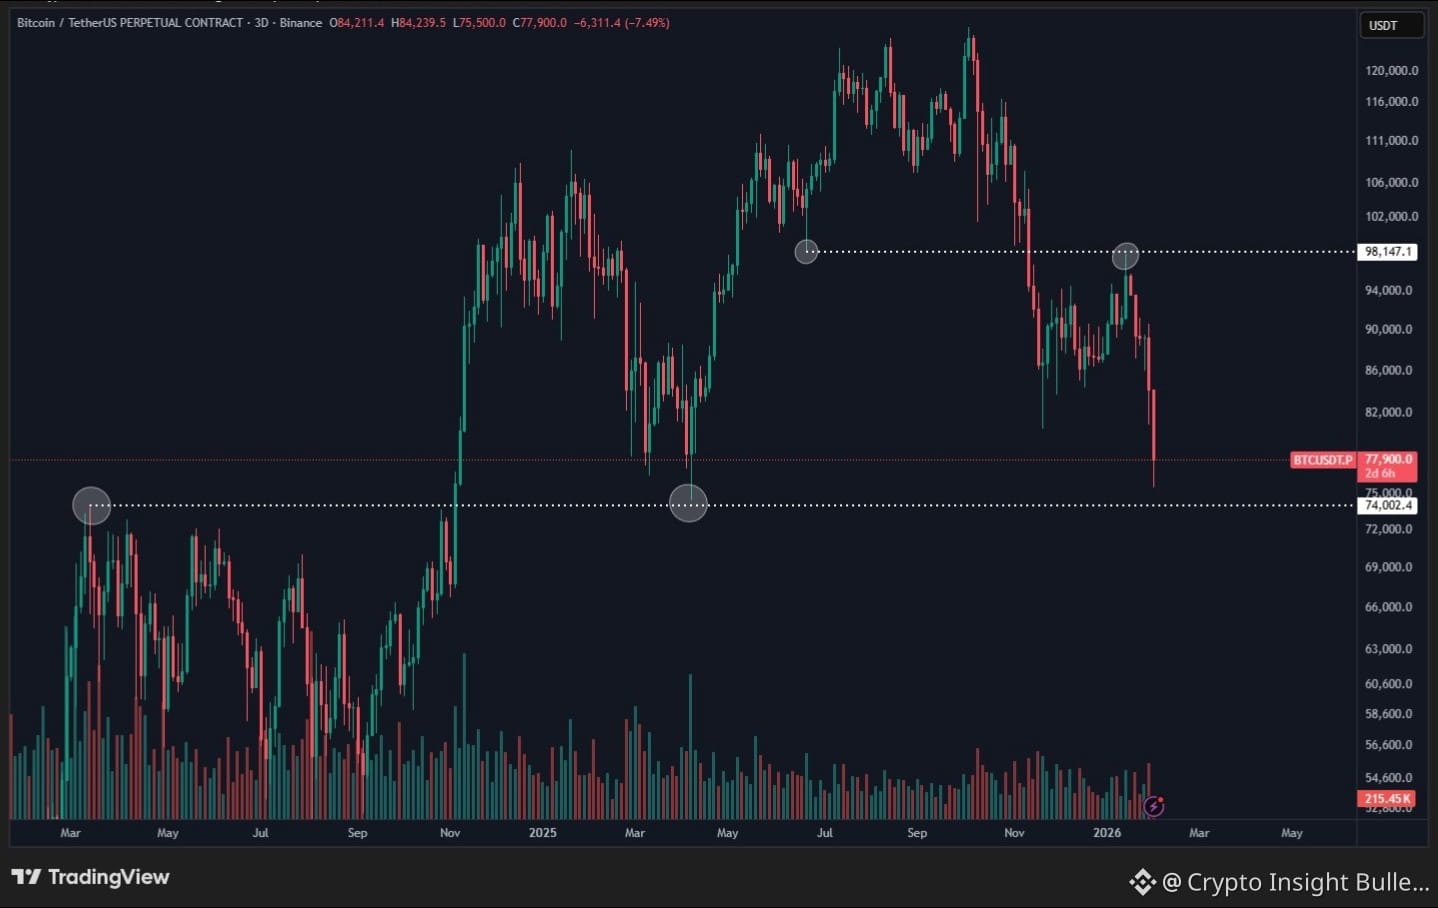
Critical Areas Lost: We just lost the $84k area, then the 82k area and the last area was the 80k area. The second critical assistance on the daily chart is only approximately, about 74,000 to 75,000 of the April, 2025 panic.
Why Is This Happening? (The Fundamental Trigger)
Charts display what is taking place and fundamentals the reason behind it. There are three particular incidences that occurred today resulting in this crash.
The "Warsh" Uncertainty: The markets are not responding well to the potential appointment of Kevin Warsh at the new Fed Chair. The fact that Trump had such a friendly team did not mean that his policies would be friendly to crypto, but the ambiguous nature of the policy by Warsh alarmed the bond market, boosting the dollar and destroying risky investments such as BTC.

Gold Crash Contagion: This is the latent cause. Gold fell about 8% yesterday. In this case of gold losses, lost money yields a margin call. In order to do that, they sell their liquid assets which in most cases are Bitcoin. This results in a funding crunch.
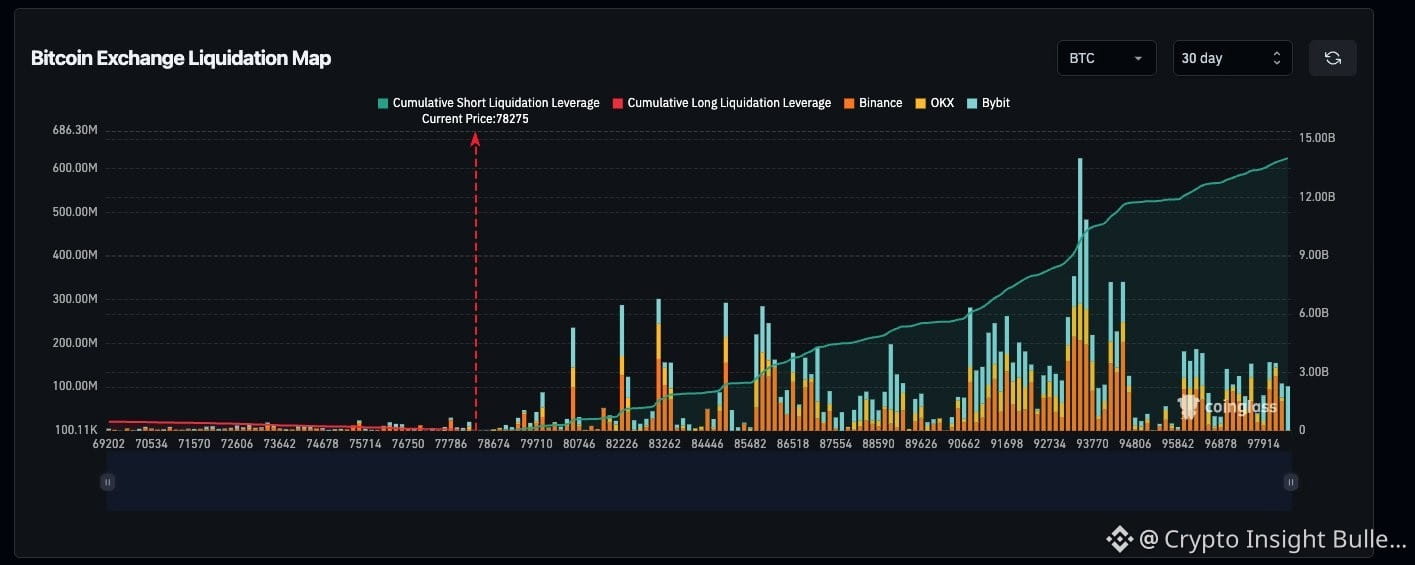
Liquidation Cascade: By the time the level at 80k was broken, there was a resultant cascade of stop-losses and long liquidations. Over 1.6 billion of jobs have been deleted in the past 24 hours.
My Customised Plan: What I am Doing, currently.
I understand the temptation to buy the dip, however, analytical data are that we need to wait. This is the way I intend to do it to-night:
I am NOT Longing Yet: The 1-hour chart still has not given out a reversal candle, such as a hammer or doji. Buying now is risky.
The Kick Kill Zone I am Following: To the alert, I have set up 74 500 to 75 200. It is the 200-day moving average on the weekly and a large historical pivot point. Assuming that the price reaches this point and that the volume goes into spurt then I will purchase on great scale.
Avoid Leverage: There is implied volatility that is high. Trading leverage in this choppy market will get you out of the market before you can even (move). I will only trade spot BTC.
The Bottom Line
The trend is very bearish now. This is not the floor at $80k anymore, this has become the ceiling. Bulls do not control until we reach a point of 82k.
Be safe, keep your money, and trade you heart and soul.#BitcoinETFWatch #USGovShutdown #WhoIsNextFedChair #MarketCorrection #FedHoldsRates $BTC @Binance Square Official