 : Bears Still in Control, But Support Is Near
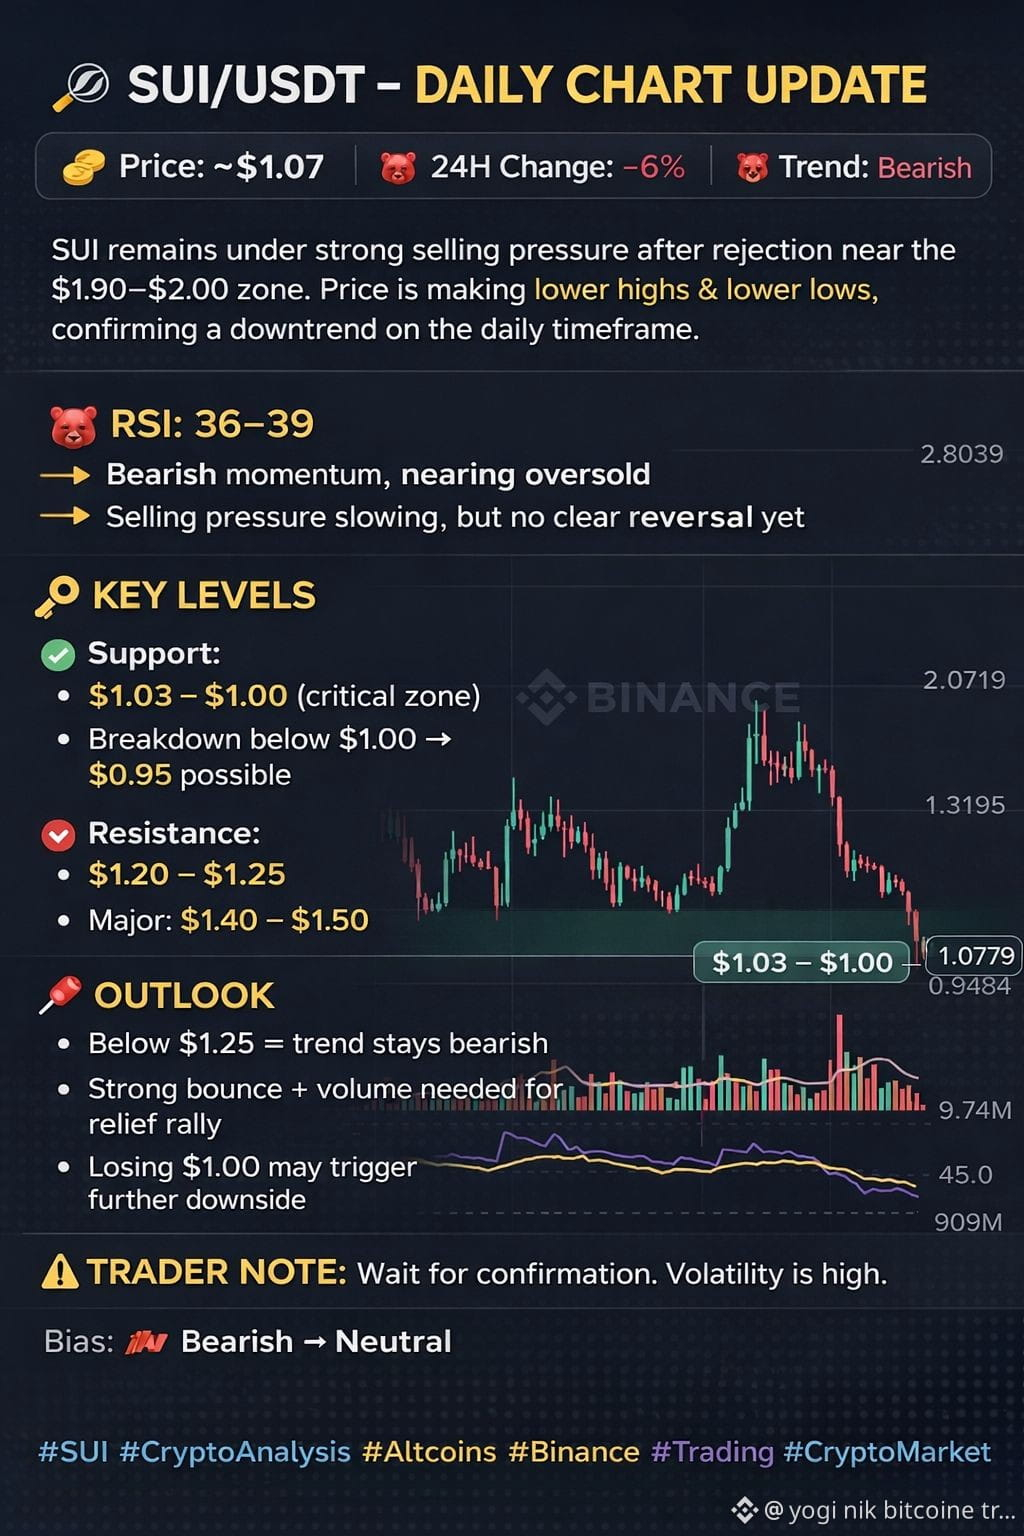
SUI is currently trading around $1.07, down nearly 6% on the day, reflecting continued bearish pressure across the market. On the daily timeframe, SUI remains in a clear downtrend, with price making lower highs and lower lows since the rejection near the $1.90–$2.00 zone.
Technical Structure
The chart shows a strong sell-off from previous highs around $2.70, followed by a brief relief rally that failed to sustain. Price has now revisited a critical demand zone near $1.03–$1.05, which previously acted as short-term support. This area is crucial for bulls to defend.
Indicators Overview
RSI (Daily): Around 36–39, indicating bearish momentum but approaching oversold territory. This suggests selling pressure may be slowing.
Volume: Recent red candles are backed by rising volume, confirming seller dominance. However, declining follow-through hints at possible exhaustion.
Moving Averages: Price is trading well below short-term MAs, reinforcing a bearish bias.
Key Levels to Watch
Support Zones:
$1.03 – $1.00 (major support)
Below $1.00 → risk of deeper drop toward $0.95
Resistance Zones:
$1.20 – $1.25
Strong resistance near $1.40 – $1.50