What actually happened to $SIREN? Is this a coordinated manipulation or just a brutal "shakeout" before the next leg up?
Everyone is talking about the massive pump, but nobody is talking about that red candle that just vaporized portfolios. I’ve been digging into the real-time data and the charts—here is the breakdown of the $SIREN carnage:
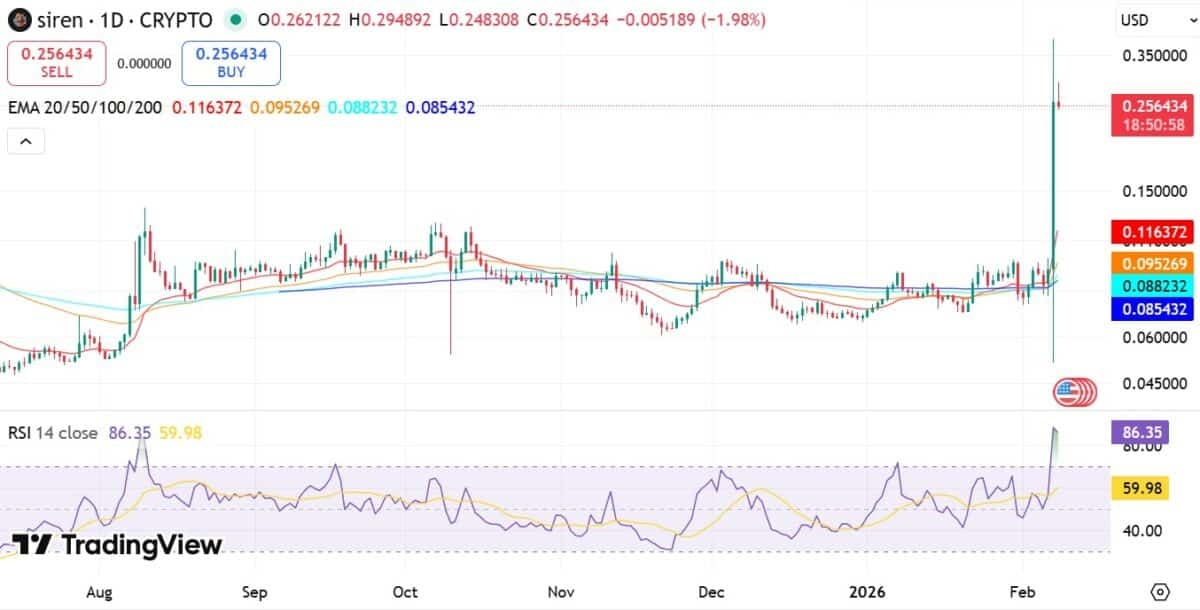
💥 The All-Time High Trap
The price tapped a psychological peak at $0.38888. That wasn't a random number; it was a massive liquidation hunt. Look at the hourly candle: a freefall from the top down to $0.087.
If you FOMO’ed at the top, you lost over 70% of your position in a matter of minutes.
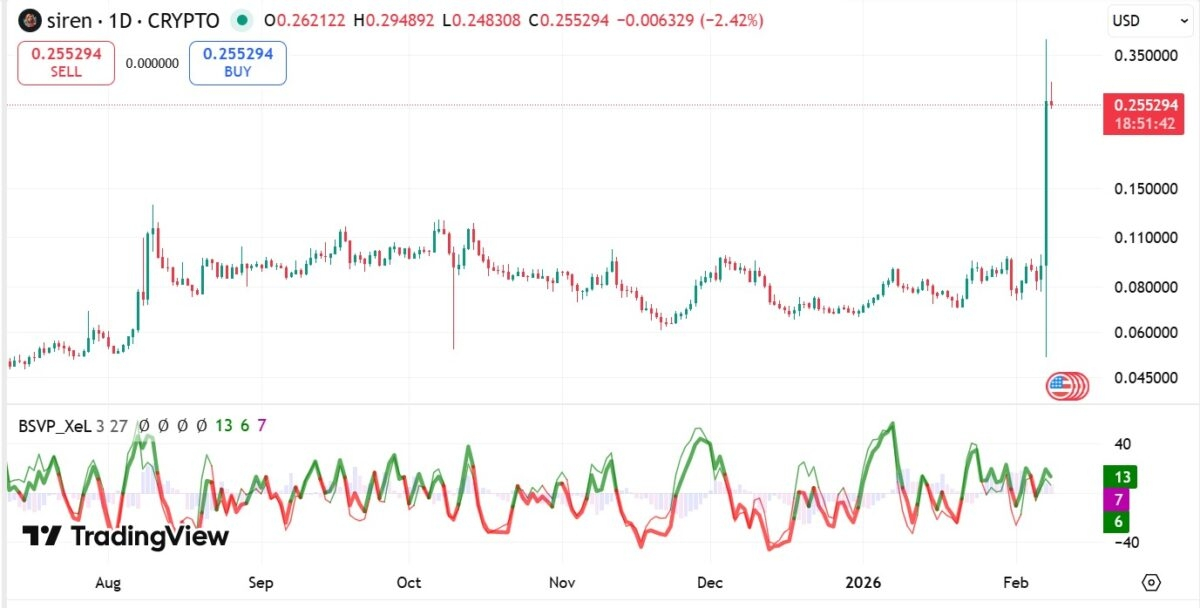
🐳 Whale Logic vs. Panic Selling
On-chain data from February 5th and 6th showed massive accumulation—over 500 million tokens were scooped up by whales at averages below $0.10.
Here’s the kicker: The "sell" volume on this crash is significantly lower than the "buy" volume that led to the pump. Despite the price drop, the big money hasn't fully exited yet.
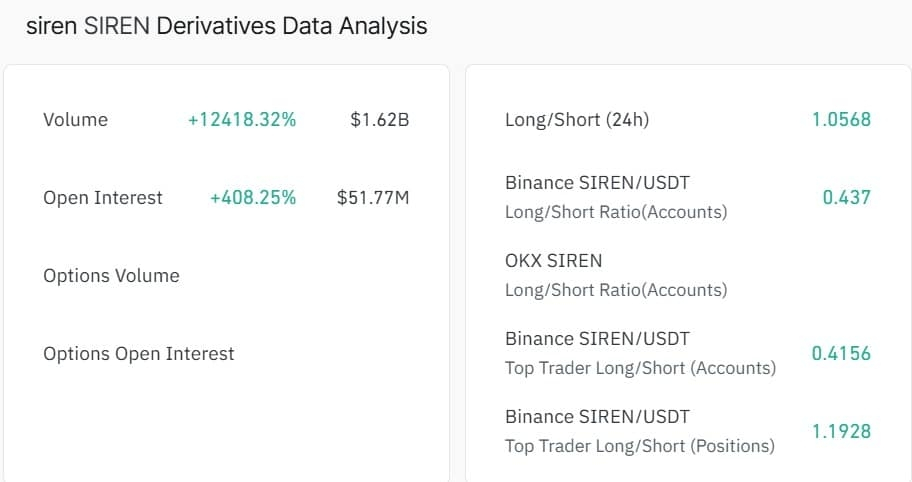
📊 The "Futures" Explosion
* Volume: Exploded by 12,418%, hitting $1.62 billion.
* Open Interest (OI): Jumped 408%.
This kind of momentum doesn't just die with one candle. This looks like a classic "leverage flush"—the market clearing out high-multiplier long positions before deciding the next real move.
🛠️ The Technical View
The price is currently resting on the EMA 200 support around $0.085. The RSI has cooled off from a hyper-overbought 86, finally giving the chart some room to breathe.
The Verdict:
This was a masterclass in "shaking out weak hands."
* Bullish Scenario: If we can close and hold above $0.11, expect a steadier, more sustainable recovery.
* Bearish Scenario: If we lose the $0.08 support, we’re likely heading back into a boring, sideways accumulation phase.
Are you holding a bag from the top, or are you waiting for the absolute bottom to entry? Drop your entry price below! 👇
#SIREN #Binance #CryptoAnalysis #WhaleAlert #tradingStrategy