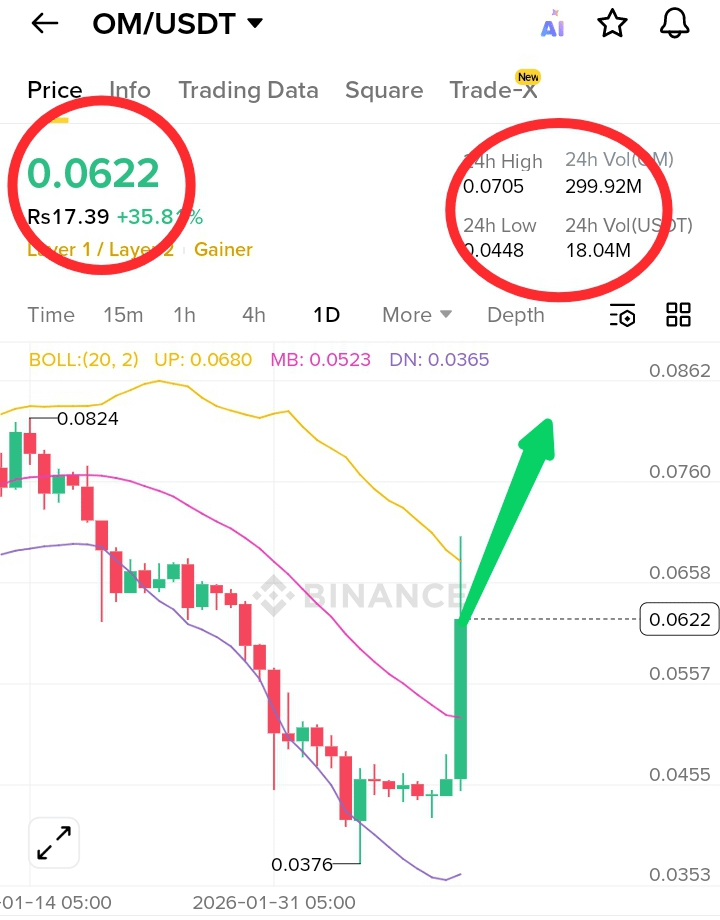
OM $OM has seen a sharp price pump driven by a combination of technical breakout, volume expansion, and market structure shift. After a prolonged downtrend, price formed a strong base near the 0.036–0.040 zone, which acted as a major accumulation and demand area. This region showed clear seller exhaustion, where repeated attempts to push price lower failed. Once buyers gained control, $OM printed a powerful bullish impulse candle that broke above short-term resistance and the mid Bollinger Band, signaling a trend reversal rather than a random spike. The breakout candle was supported by a strong increase in 24h volume, confirming that real demand entered the market instead of low-liquidity manipulation.
From a technical perspective, OM’s price expanded rapidly toward the upper Bollinger Band, indicating volatility expansion and momentum continuation. The previous resistance zone around 0.055–0.058 has now flipped into a key support area, strengthening the bullish structure. Order book data also shows bid dominance, which confirms that buyers are currently controlling price action. Additionally, the sharp move triggered short liquidations, accelerating upside momentum as short sellers were forced to cover positions. Such moves are common when a heavily oversold asset transitions into a markup phase.
Market-wise, this pump appears to be a relief rally following extended bearish pressure. Coins that stay suppressed for long periods often experience explosive upside once sentiment shifts and volume returns. While short-term pullbacks or consolidation are possible after such a strong move, holding above newly formed support zones would keep the bullish bias intact. Sustained volume and stable price structure will be critical for continuation. Overall, $OM recent pump reflects a genuine technical reversal supported by volume, structure change, and renewed trader interest rather than pure speculation.
 OM0.0612+6.99%