

The SPDR S&P 500 ETF Trust, trading under the ticker SPY on NYSE Arca, is currently positioned at $693.77, navigating a critical juncture in its technical structure. This analysis examines the key price levels, trend dynamics, and potential trading scenarios based on the chart pattern.
Current Market Position and Trend Structure
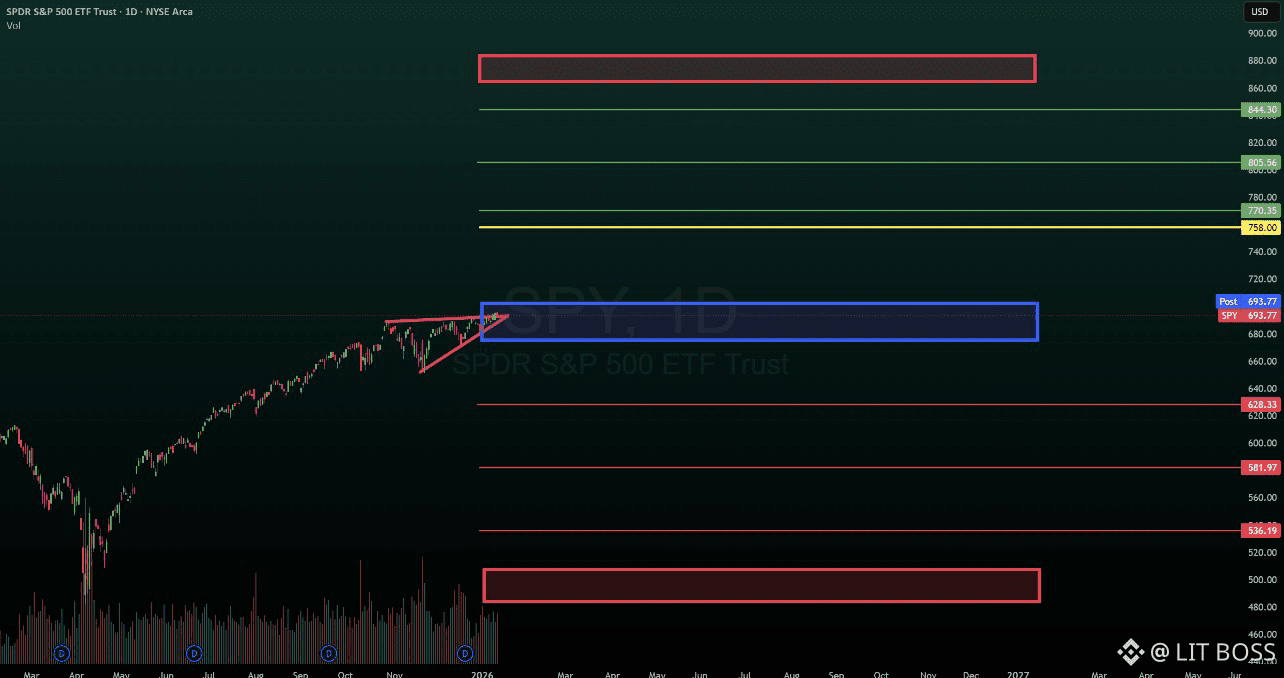
The chart reveals a robust uptrend that has been in place since early 2024, with price advancing from the lower support zone around $480-$510 to current levels near $694. This represents a significant rally that has been supported by a well-defined ascending trendline, marked by the purple diagonal line originating from the March 2024 low. The integrity of this trendline has been maintained throughout the advance, suggesting strong underlying momentum and buyer commitment at higher levels.
Critical Support Levels
The price structure shows several layers of support that could provide buying interest on any potential pullback. The most immediate support zone sits at $628.31 to $629.00, which represents a logical area for buyers to defend if the current breakout attempt fails. Below that, additional support can be found at $581.97, a level that coincides with prior consolidation activity. The mid-level support at $535.80 would represent a deeper retracement but still maintain the overall uptrend structure. The most significant support zone remains at the $480-$510 range, highlighted by the red box at the lower portion of the chart. This area represents major historical support and would likely attract substantial buying interest if tested again.
Resistance Zones and Upside Targets
Price is currently testing a critical resistance zone marked by the blue box between $680 and $695. This area represents immediate overhead supply and a key decision point for the market. A successful break above this zone would likely trigger momentum toward the next resistance level at $758.00, marked by the yellow line on the chart. Beyond that, the market faces additional resistance at $770.35, followed by a more substantial zone between $805.56 and $809.00. The most significant overhead resistance is identified by the large red box in the upper portion of the chart, spanning from approximately $860 to $880 and beyond. This zone represents a major supply area that would require considerable buying pressure to overcome.
Volume Characteristics and Market Participation
The volume bars at the bottom of the chart provide insight into market participation at key turning points. The blue circles highlight significant volume spikes that typically occurred during important swing lows and consolidation periods throughout 2024. These volume events suggest periods of accumulation where institutional buyers were likely building positions. The relationship between price advances and volume patterns indicates healthy market participation during the uptrend, though traders should monitor whether volume expands on any breakout attempts above current resistance.
Trading Scenarios and Market Implications
Two primary scenarios emerge from the current technical setup. In the bullish case, a clean break and hold above the $695 level would confirm the breakout from the blue resistance box and open the path toward $758. If momentum continues, extended targets at $770, $805, and eventually the $860-$880 zone become realistic objectives. This scenario would be validated by strong volume on the breakout and follow-through buying in subsequent sessions.
The bearish alternative involves rejection at current resistance levels, which could trigger profit-taking and a pullback toward support. The initial downside target would be the $628-$629 zone, where buyers would likely attempt to defend. A failure at that level could lead to deeper retracement toward $582, though such a move would still respect the overall uptrend structure as long as the purple ascending trendline remains intact. A break below $535 would call into question the sustainability of the entire rally from early 2024.
The chart’s projection extends into 2025-2027, suggesting that these technical levels will remain relevant for longer-term positioning. Traders and investors should monitor price action at the current resistance zone closely, as the resolution of this test will likely determine the market’s direction for the next significant move. The combination of well-defined support and resistance levels, clear trend structure, and identifiable volume patterns provides a solid framework for making informed trading decisions in the SPDR S&P 500 ETF Trust.