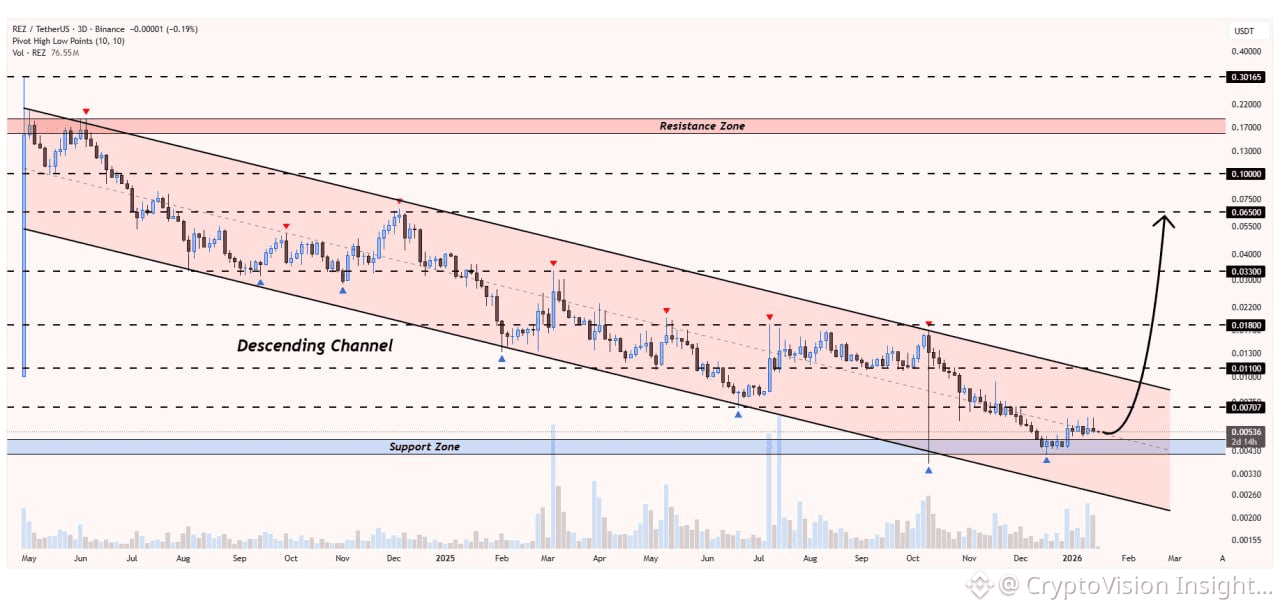
"Hey everyone! Looking at the $REZ chart on the 3-day timeframe, I noticed a classic Descending Channel pattern that deserves our attention. 📉➡️📈
Key Points of Analysis: 1️⃣ Support Zone: The price is testing the region between $0.00430 and $0.00536. Historically, there has been a lot of buying defense here. 2️⃣ Accumulation: The volume at the bottom of the channel suggests that large players may be building positions. 3️⃣ The Trigger: The black arrow indicates the path to the breakout. If the price closes above the upper line of the channel, the main target is there at $0.06500.
Resistance Targets:
$0.01100 (Short term)
$0.03300 (Trend confirmation)
$0.06500 (Final target of the (Projection)
⚠️ Risk: This scenario is invalidated if we lose the support level of $0.00430. Risk management is crucial!
What do you think? Is it time to accumulate or wait for the breakup to be confirmed? Leave your opinion in the comments! 👇
Note: This is only a technical analysis and does not constitute investment advice. Do your own research (DYOR).