On the D1 chart, gold's primary trend remains upward. A break above $4642.97 would signal a resumption of the uptrend; a drop below $4407.83 would shift the secondary trend downward; and a breach of $4274.02 could trigger a reversal of the primary trend to bearish.
The 50-day moving average at $4287.02 serves as both an effective trend indicator and a key support level.
The current gold rally began on October 28, 2025, from $3,886.46, reaching a historic high of $4,642.97. Its 50% retracement level is at $4,264.71, which, together with the primary support at $4,274.02 and the 50-day moving average at $4,287.02, forms a support zone.
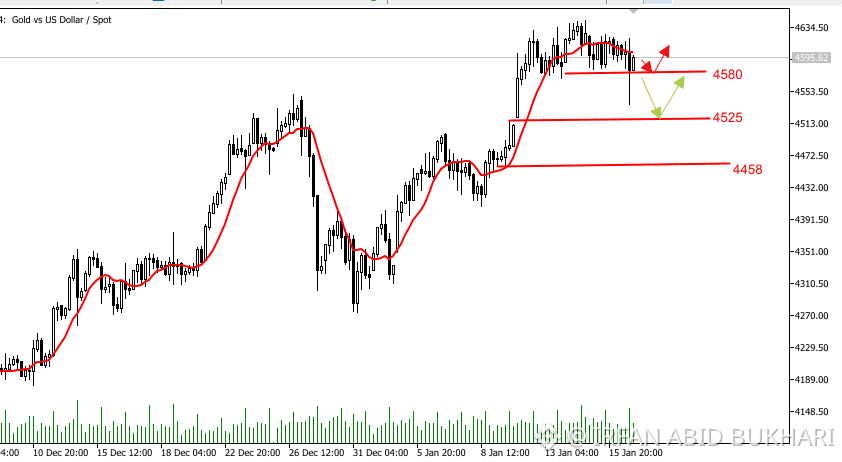
In the short term, the $4,525.40 and $4,458.49 levels—both 50% retracement points—represent key target zones likely to attract buying interest.
Amid concerns over potential escalation in Iran, gold prices may maintain firm momentum. Fresh buying pressure could even propel prices toward the all-time high of $4,642.97. However, if geopolitical risks significantly subside, profit-taking could pressure gold back toward the $4,525.40-$4,458.49 range. Overall: Gold broke below the psychological $4,550 level but failed to sustain the decline, keeping the uptrend intact! Next week, focus on the critical $4,525 support—also the gap left from the previous rally! (Also monitor weekend geopolitical news for better Monday gold trading guidance) Continue prioritizing Buy Orders in trading! Monday's opening will likely see short-term continuation of the uptrend! Short-term strategy: Buy: 4582-85 TP: 4615--18-20 SL: 4570
FOLLOW LIKE SHARE