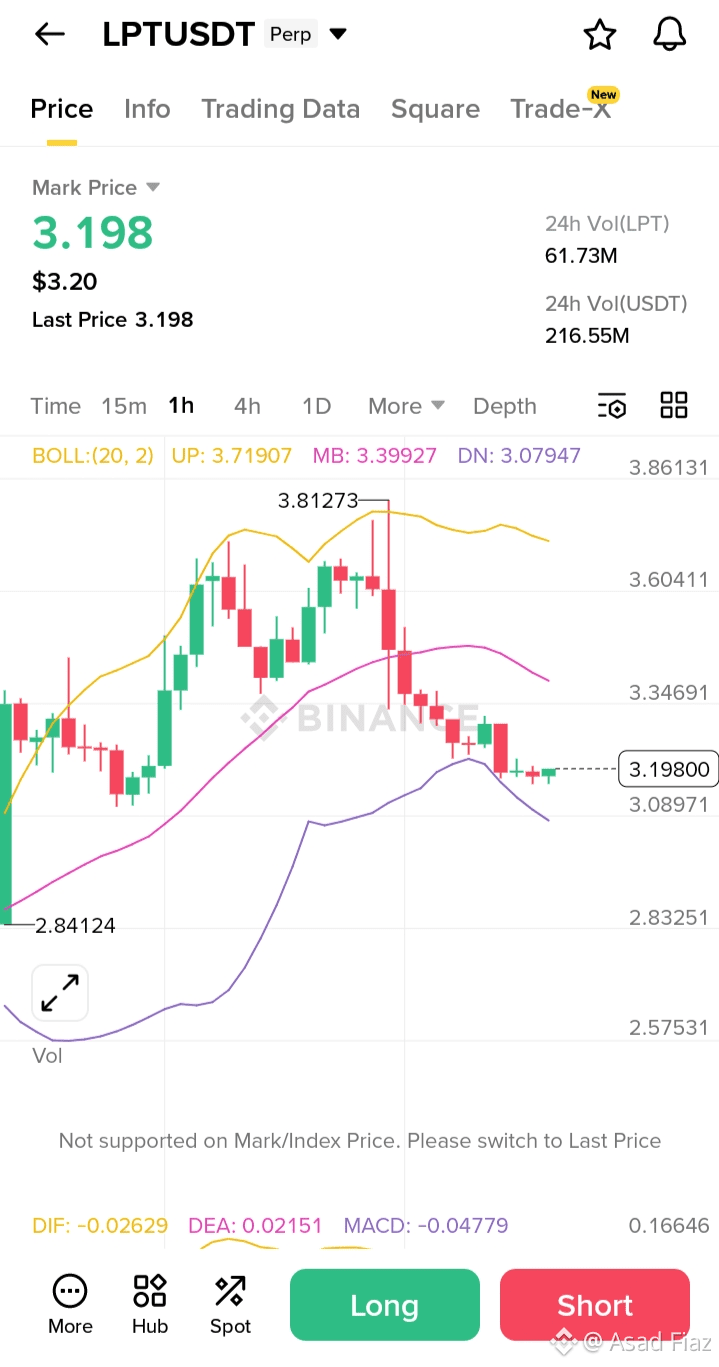
$LPT is currently under pressure on the 1H chart, trading at $3.198 with a -7.00% drop today. After a rejection from the $3.81 level, the price is now testing the lower Bollinger Band.
Technical Breakdown:
Trend: Bearish momentum. The price is trading below the middle Bollinger Band ($3.39).
RSI (6): 30.71 – Entering the Oversold zone. This suggests the selling pressure might be peaking, and a relief bounce could be near.
MACD: Negative crossover with increasing red histograms, showing active bearish control.
Key Levels: Support at $3.07 | Resistance at $3.39.
Verdict: The immediate outlook is Bearish. However, keep a close eye on the $3.07 - $3.10 zone. If LPT holds this support, we could see a quick "Oversold Bounce" back to $3.40. Avoid shorting at these lows!
Will LPT hold the $3.00 psychological level? Share your thoughts below! 👇
Disclaimer: Not financial advice. DYOR.
#LPT #CryptoAnalysis #BinanceSquare #WriteToEarn #TradingSignals