I've seen momentum reversals before but the speed of Walrus RSI collapse caught me off guard. WAL sits at $0.1231, down 3.38% with RSI crashing from yesterday's 58.62 to today's 36.77. That's a 22-point drop in one session. Volume at 16.01 million tokens—triple yesterday's 4.59 million—confirms this isn't just noise. When RSI falls that hard on volume that high, the momentum shift is real and everything bulls thought they had just evaporated.
RSI measures momentum over 14 periods. It's designed to smooth out volatility and show underlying trends. Single-session moves this large are rare because they require sustained directional pressure to overcome the averaging effect.
Yesterday Walrus RSI was 58.62. First time above 50 in over a week. Bulls were celebrating. Momentum had shifted. Oversold was behind us. Recovery was starting. Technical indicators confirmed the bounce. All the hopeful narratives that accompany green days and improving charts.
Here's what caught my attention. One day of real selling wiped all that out completely. RSI didn't just fall back below 50—it crashed to 36.77. That's not giving back recent gains. That's destroying the entire recovery narrative and then some. You don't get 22-point RSI drops on light volume or weak conviction. This required heavy selling pressure sustained throughout the session.
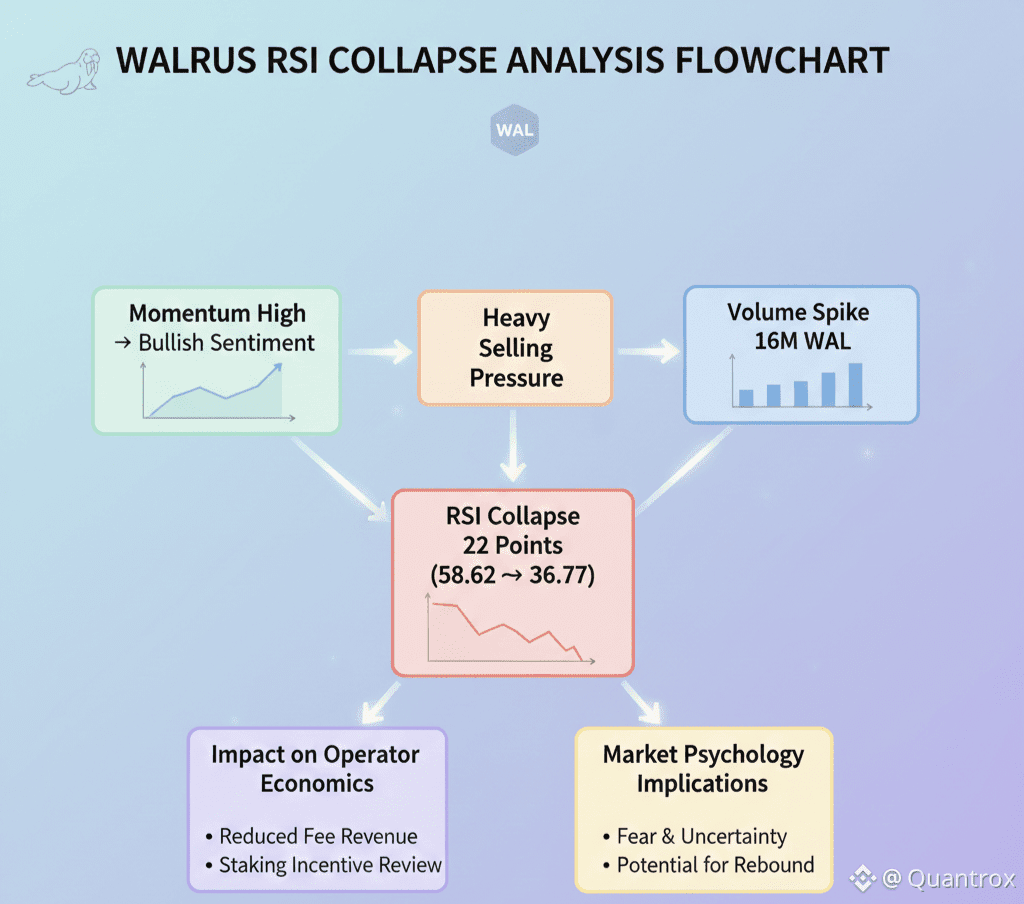
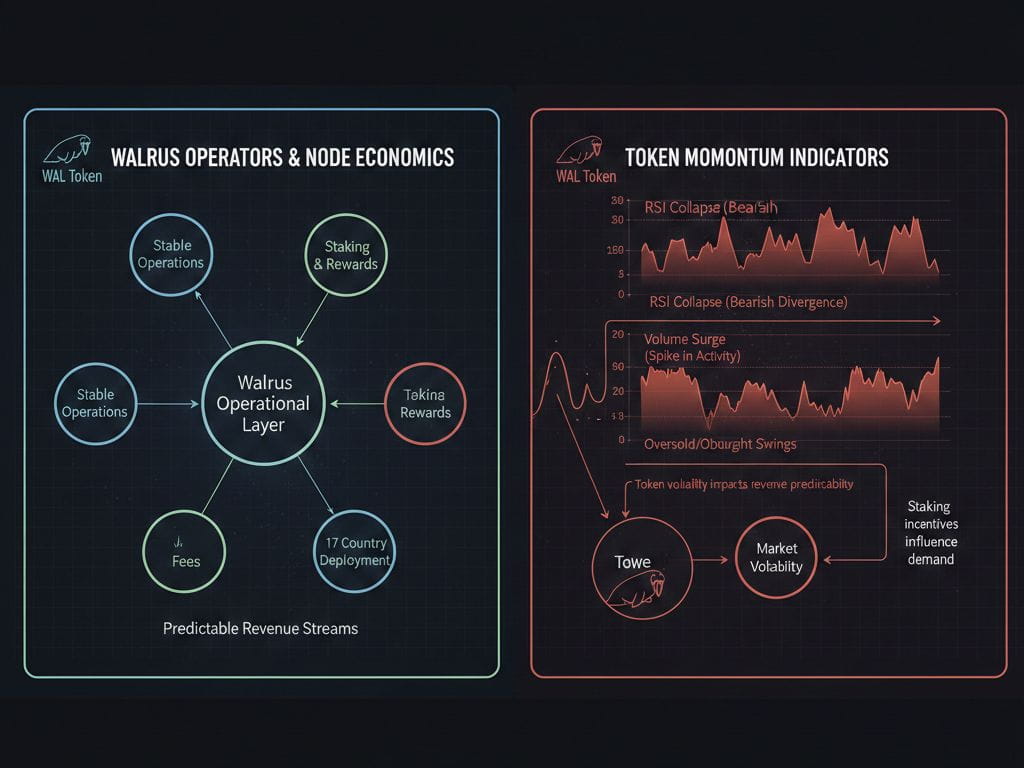
The 105 operators running Walrus infrastructure don't care about RSI readings. They're not adjusting operations based on momentum indicators. But the RSI collapse reveals something about holder psychology that matters for anyone evaluating whether to join as operator or delegate stake to existing nodes. The conviction isn't there. Bounce attempts fail immediately when tested.
Operators have to stake WAL to participate. They earn fees when users pay WAL for storage. They get slashed if they fail challenges. Standard DPoS economics. But those economics assume some stability in the token value over medium time horizons. When RSI can swing 22 points in a day, the stability assumption breaks down. Fiat revenue from WAL fees becomes wildly unpredictable.
Volume of 16.01 million WAL confirms the RSI drop wasn't just thin trading moving indicators. Real participation happened. Actual tokens changed hands. The momentum shift is backed by volume, which makes it legitimate rather than statistical noise. Yesterday's RSI surge to 58.62 happened on declining volume. Today's RSI collapse happened on tripling volume. Guess which one matters more.
The circulating supply of 1.58 billion WAL includes mostly locked tokens that can't participate in daily trading. The RSI reading is measuring momentum in the small tradeable float. But even accounting for that, a 22-point single-day move is extreme. The liquid supply that can actually trade just showed you where momentum really sits—downward, with conviction.
Here's what makes this RSI collapse particularly brutal. It invalidates every bullish technical signal from the past two days. RSI above 50? Gone. Positive momentum building? Reversed. Oversold conditions resolving? Back worse than before. The bulls got two days of hope and one day wiped it all out with authority.
My gut says the RSI surge to 58.62 was a trap. Let momentum indicators look good. Let bulls get comfortable. Let narrative shift toward recovery. Then dump with volume and crater the indicators before anyone can react. Classic distribution where technical strength is manufactured on low volume then destroyed on high volume before it can build into something real.
The RSI at 36.77 is deep oversold territory. Technically that should mean bounce incoming, momentum reversal likely, sellers exhausted. But we just saw what happened the last time RSI climbed out of oversold. It got to 58.62 then collapsed. Why should anyone believe the next bounce attempt is different? Yesterday's RSI reading offered false hope. Today exposed it as fake.
Epochs on Walrus last two weeks. RSI collapsed mid-epoch. Storage pricing was already set and won't change until the boundary. Applications using Walrus aren't affected by momentum indicators. They've got capacity through the epoch regardless of what RSI does. But the indicator collapse reveals that market sentiment is nowhere near as stable as infrastructure operations.
The pricing mechanism where operators vote at 66.67th percentile assumes operators can predict revenue needs over the next epoch. When RSI can move 22 points in a day, that predictability breaks down. Operators setting prices for the next two weeks have to account for the possibility that WAL crashes mid-epoch and their fiat revenue falls even if WAL-denominated fees stay constant.
Walrus processed over 12 terabytes during testnet when RSI didn't exist because there was no token to measure. Now processing 333+ terabytes on mainnet while RSI swings violently reveal market instability. The infrastructure layer operates independently of momentum indicators but operator economics get affected when indicators move this hard this fast.
The 17 countries where Walrus operators run infrastructure all face the same RSI collapse. Geographic distribution doesn't insulate from token volatility. Every operator just watched their revenue token's momentum indicator crater 22 points in one session. That creates uncertainty about whether current economics are sustainable or just temporarily viable before the next collapse.
What you'd want to know is whether RSI at 36.77 represents actual capitulation or just another stop on the way down. Traditional technical analysis says oversold RSI means bounce likely. But Walrus just demonstrated that RSI improvements can be fake and reversals can be violent. The indicator lost credibility today by collapsing so hard after breaking above 50.
Walrus infrastructure keeps running through all of this. Storage nodes don't shut down because RSI fell. Applications don't stop storing data because momentum indicators reversed. The operational layer is insulated from trading dynamics. But new participants evaluating whether to join—either as operators or delegators—are watching these indicator moves and doing risk calculations.
The bet that RSI breaking 50 meant something turned out to be wrong. Completely, immediately wrong. Bulls had one day of celebration before getting destroyed. That teaches market participants not to trust momentum indicators in Walrus trading. If RSI readings are unreliable—surge on low volume, collapse on high volume—then what technical analysis works?
Here's what's clear though. The RSI collapse from 58.62 to 36.77 wiped out every technical signal bulls thought they had. Momentum reversed with authority. Volume confirmed it. The 22-point drop in one session isn't subtle. It's the market screaming that the bounce was fake and selling pressure dominates.
The two green days that preceded today built RSI from oversold to neutral to bullish. Progressive improvement over multiple sessions. Today destroyed all that progress in one move. Faster to fall than to rise. Easier to break technical strength than build it. Classic behavior in downtrends where rallies are temporary and reversals are violent.
Time will tell whether RSI at 36.77 marks actual bottom or just another oversold reading that gets ignored. What's certain is that yesterday's RSI at 58.62 meant nothing. It was fake strength that evaporated immediately when tested. The collapse today revealed that momentum wasn't building—it was waiting to fail. And when it failed, it failed hard with volume confirming the move was real.