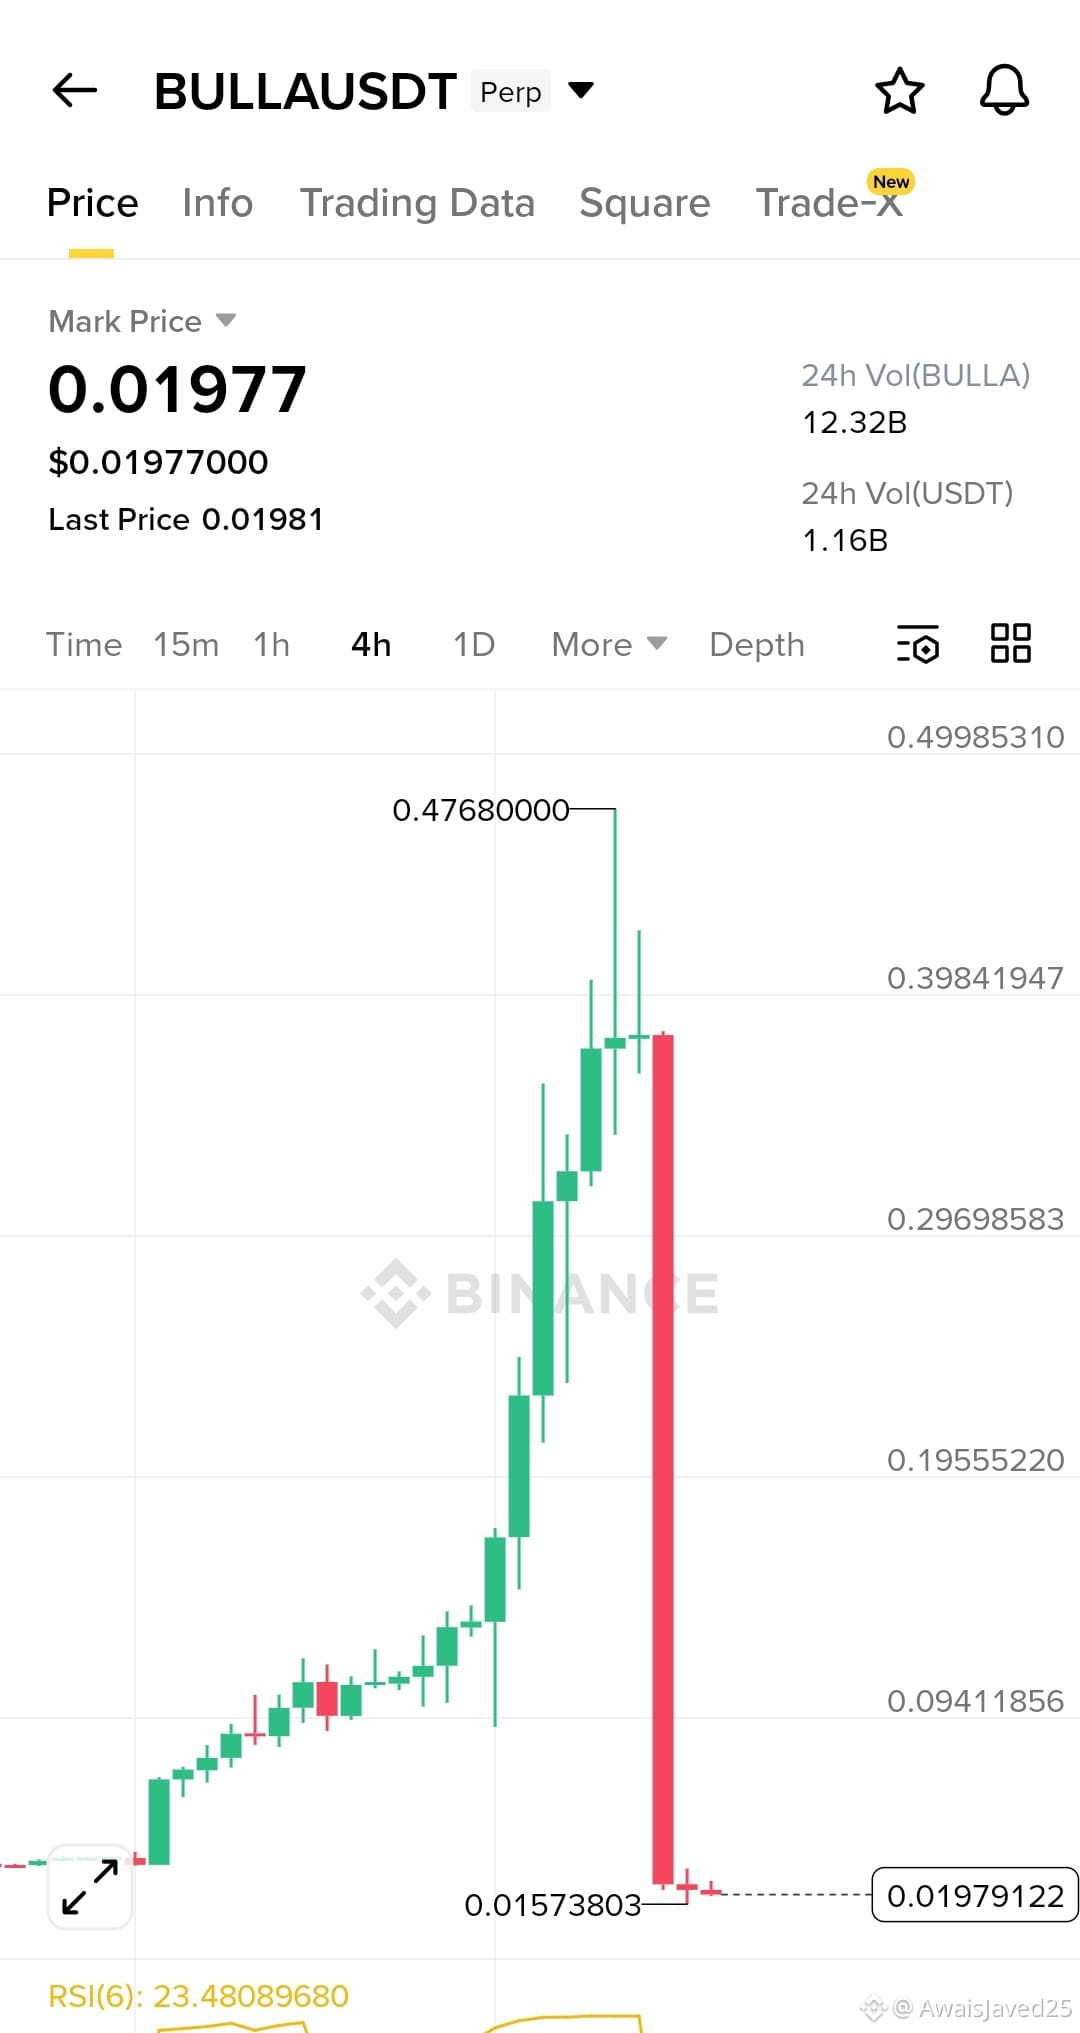
BULLA/USDT trading pair has just suffered a complete market crash which resembles the sudden market declines that occur during "flash crashes" and when investors exit high-risk meme tokens.
"Elevator Down" Technical Analysis shows extreme downward movement which results in a -96% drop. The price has fallen from above $0.4768 to its current level of $0.0197.
1. Price Action & Structure
Pump Before the crash the token experienced a parabolic uptrend through green candles which probably resulted from speculative hype and low liquidity.
Dump
Massive red candle marks the point when all buyer support vanished. The price moved beyond all possible support points during a single 4-hour period.
RSI
RSI indicator shows a value of 23.48 which means the market has reached "deeply oversold" conditions. The meme coin market usually treats this pattern as a cycle end point whereas most markets see it as a "dead cat bounce" pattern.
2. Volume & Liquidity
The BULLA token has achieved a 24-hour volume of 12.32 billion.
USDT token has experienced a 24-hour volume of 1.16 billion. The crash volume demonstrates intense market selling activity. Social media personality Hasbulla experiences these token movements when "whale" investors choose to sell off their entire holdings at once.
Fundamental Context shows that BULLA operates as a meme token on the BNB Chain. The token value exists only through market speculation which depends on the brand power of Hasbulla Magomedov and the overall market "bullish" sentiment.
Market Sentiment
Market reached an all-time high of approximately $0.55 on BULLA at February 1-2 2026 but experienced an immediate price drop.
"Rug" Risk
The token maintains high price fluctuations because people doubt its essential value. The reports present two major issues which include the absence of practical applications and the tokens previous ties to influencer-driven initiatives that resulted in sudden price drops.