I’ve analyzed the $BTC chart closely and found two conflicting perspectives based on different trading tools. Let’s break down both views.

1. Price Action (Potential New All-Time High)
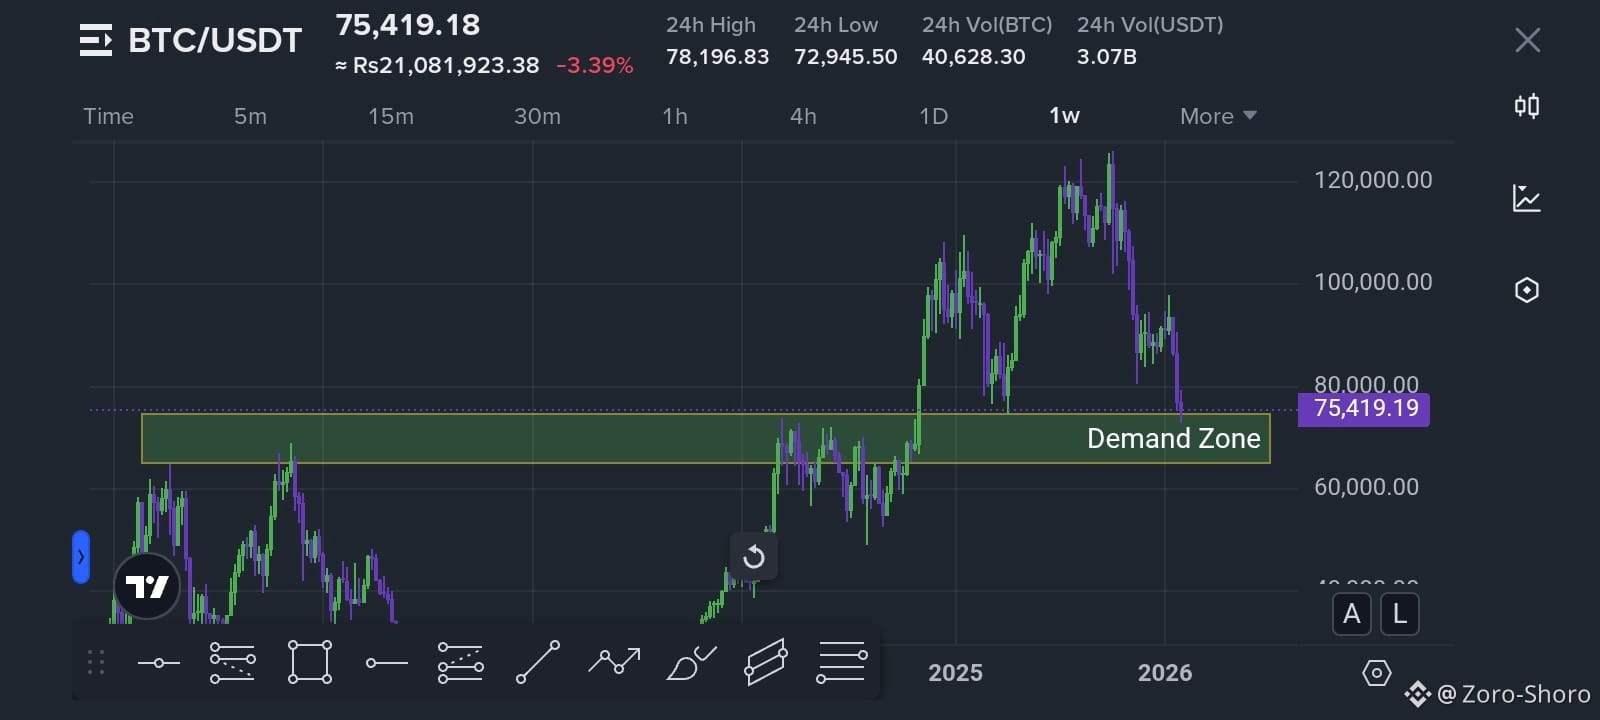
Price action suggests that BTC/USDT is currently sitting in a very strong demand zone. This indicates a high probability of price expansion and the potential for a new all-time high from the current area, highlighted by the green rectangle. $SOL

2. Market Structure (Trend Shift)
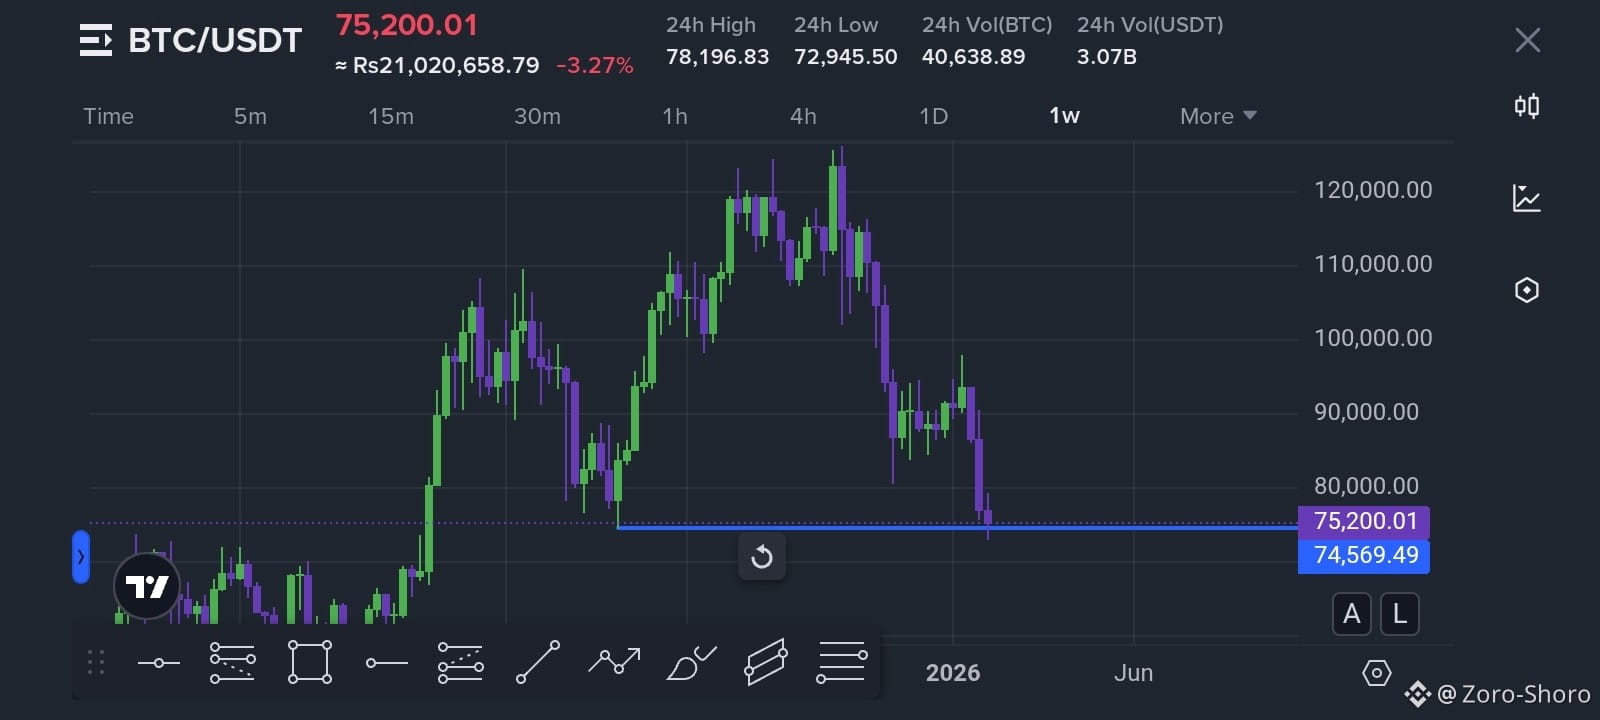
From a market structure perspective, BTC/USDT has broken a higher low on the 1W timeframe and formed a lower low after years, confirming a trend shift. This implies that BTC is now bearish on higher timeframes, which could mean no new all-time high for a long period. $XRP

Final Thought
Which approach do you trust more — price action or market structure?
Comment below; I’m interested to know your view.
I hope this analysis helps in your crypto journey. 📊