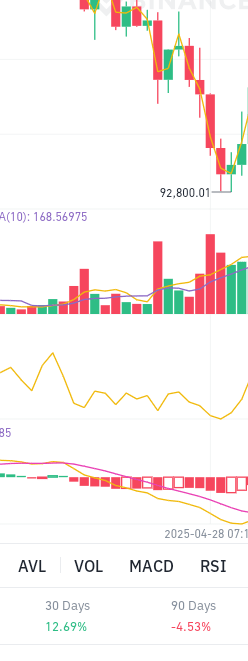
Below are the functions of the indicators AVL, VOL, MACD, RSI in simple language:
1. AVL (Average Volume)
Work: Shows the average trading volume (transaction amount) over a specific time.
Usage: Indicates how much participation or interest there is in the market.
See: If the volume suddenly increases, a large movement may occur.
2. VOL (Volume)
Work: The number of coins/shares traded within a specific time.
Usage: Indicates how much buying and selling is occurring in the market.
See: Large green/red bars mean there is significant buying and selling.
3. MACD (Moving Average Convergence Divergence)
Work: Indicates how strong the trend (upward/downward) is.
Usage: Helps to provide buy or sell signals.
See: When the MACD line and the signal line cross—buy/sell signals are obtained.
Bars: Green means bullish (up), red means bearish (down).
4. RSI (Relative Strength Index)
Work: Shows whether the market is overbought or oversold.
Usage: To catch when the trend might reverse.
Above 70: Overbought, the price may drop.
Below 30: Oversold, the price may rise.
In short:
AVL/VOL: Indicates how much trading is happening.
MACD: Trend and strength
RSI: Indicates whether it is being overbought/sold.