Special reminder: BTC whales continue to make small purchases.
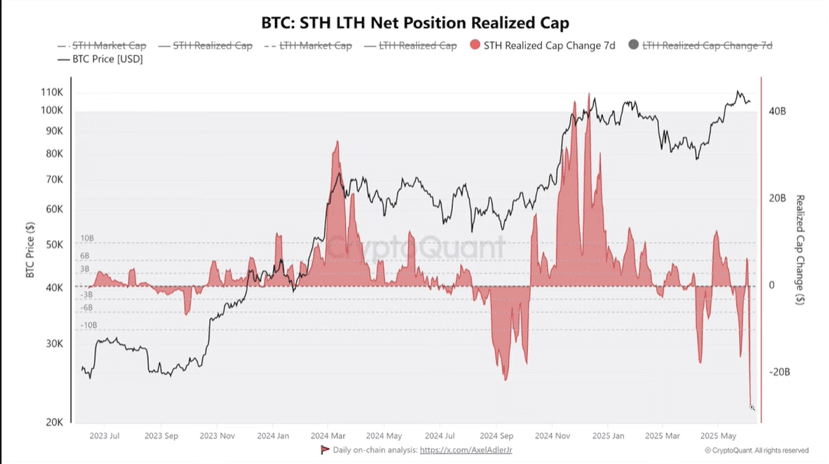
BTC short-term holders are selling in large quantities.
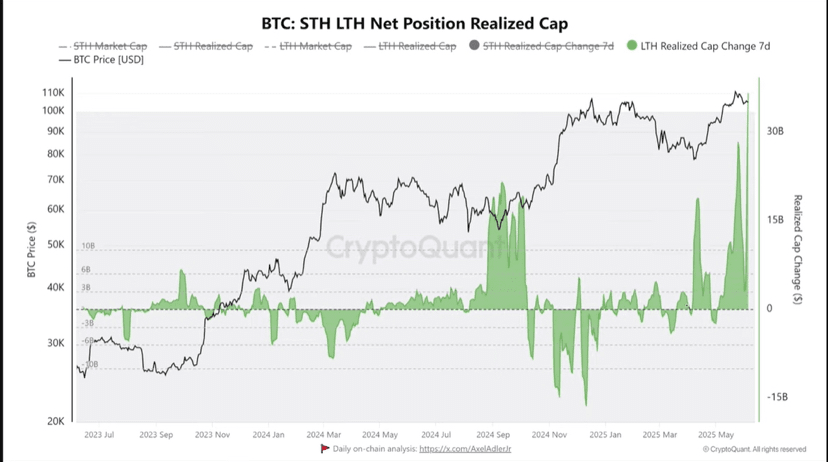
BTC long-term holders have seen the largest recent buying.
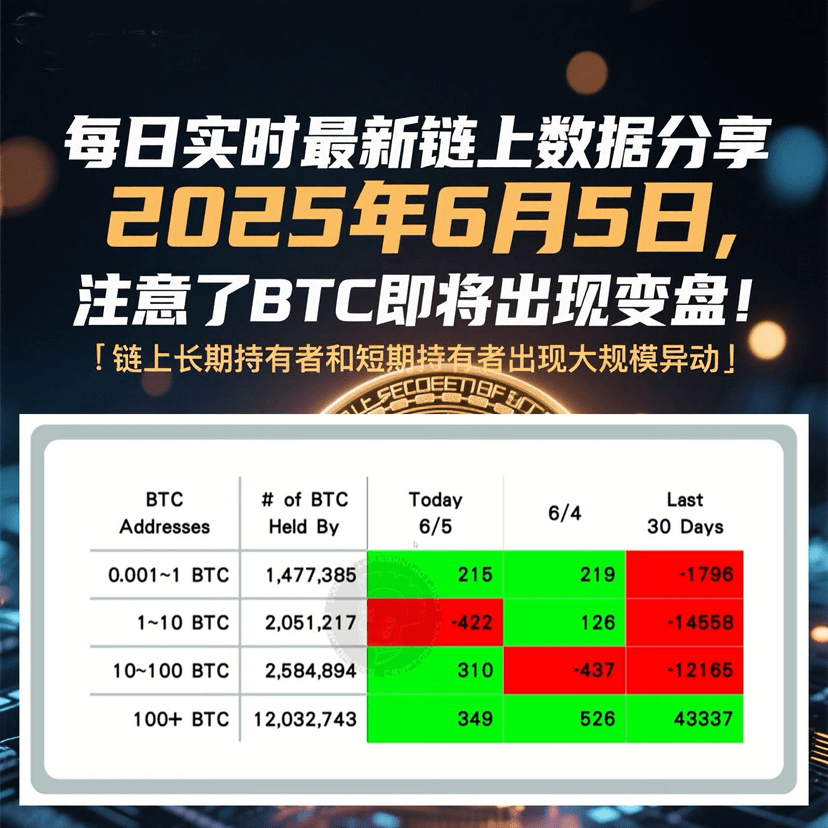
Attention! BTC is about to change trend!!! Long-term and short-term holders on-chain are experiencing massive movements!
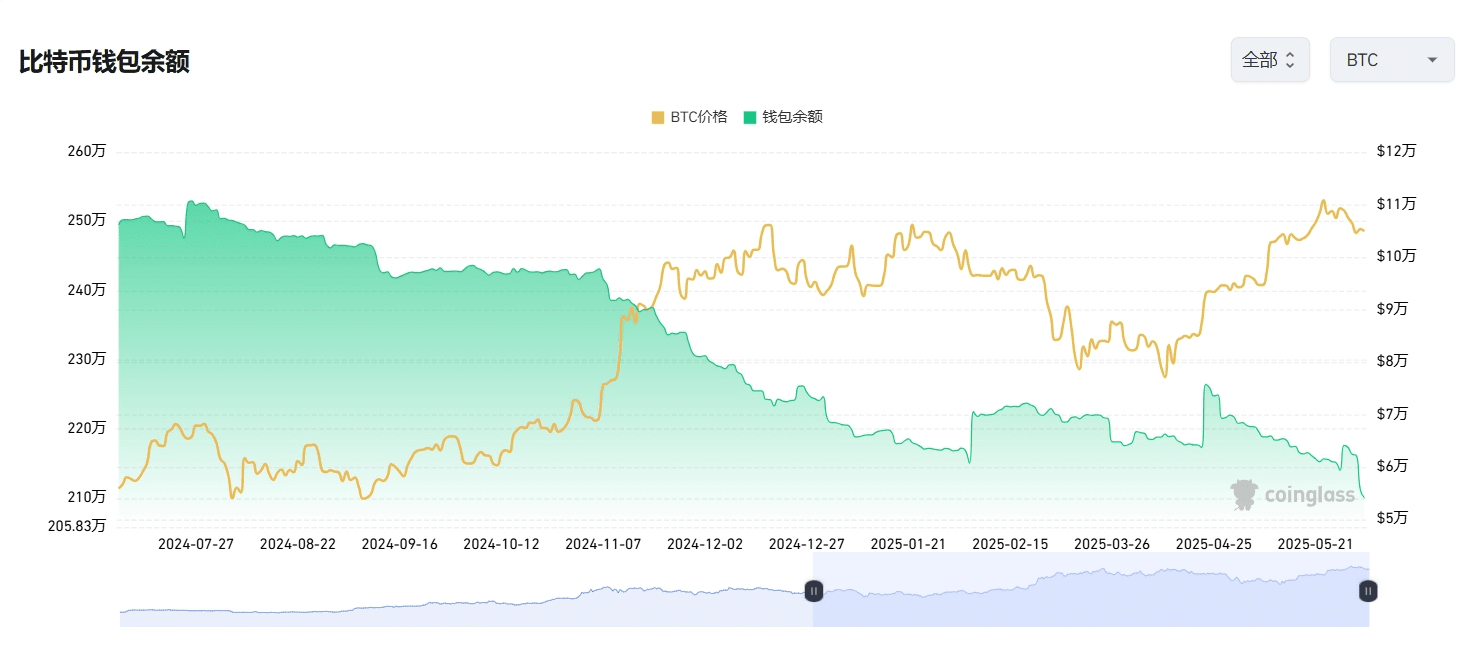
BTC long-term holders and short-term holders' positions BTC short-term holders are selling in large quantities & BTC long-term holders have seen the largest recent buying. Given the exchange's BTC inventory situation, a significant number of long-term holders are optimistic about BTC's future trend, purchasing a large amount of spot from exchanges and then withdrawing to their own wallets!!!
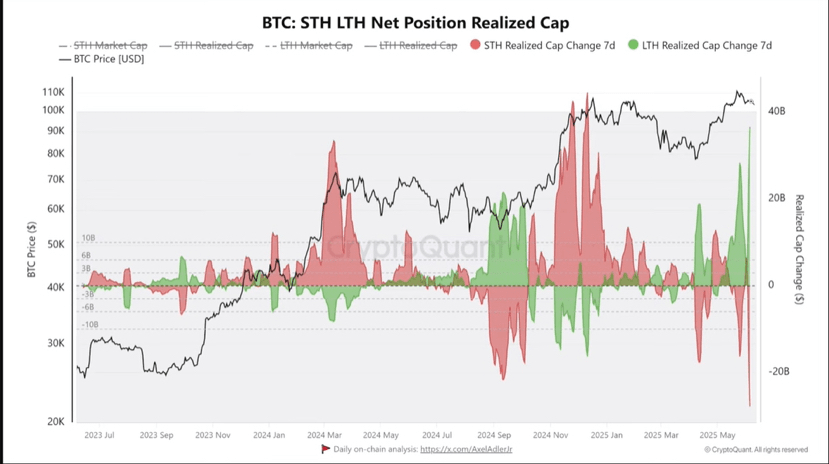
BTC short-term holders are selling in large quantities.
BTC long-term holders have seen the largest recent buying.
BTC, ETH inflow and outflow from exchanges BTC, ETH have continuously flowed out of exchanges at a new low, but the outflow rate has slowed.
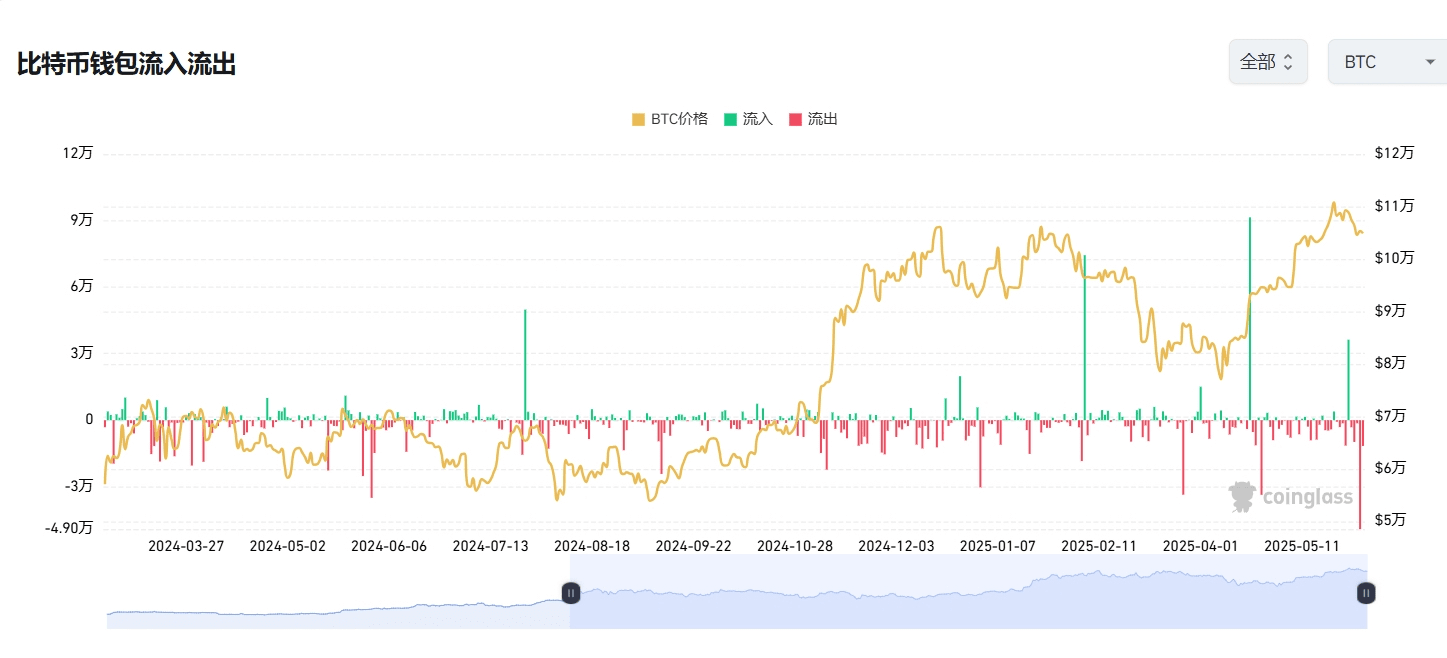
** BTC, ETH inflow and outflow data interpretation.
BTC inflow and outflow from exchange wallets are core on-chain indicators of the crypto market, directly reflecting the direction of main funds and market sentiment.
Inflow ↑ Holders depositing BTC into exchanges, selling pressure expectations increase, caution against short-term declines.
Outflow ↓ Holders withdrawing BTC from exchanges, accumulation/lock-up willingness increases, indicating mid-term bullish.
1. Greed and Fear Index Today: 58 Neutral, up 1 point from yesterday.

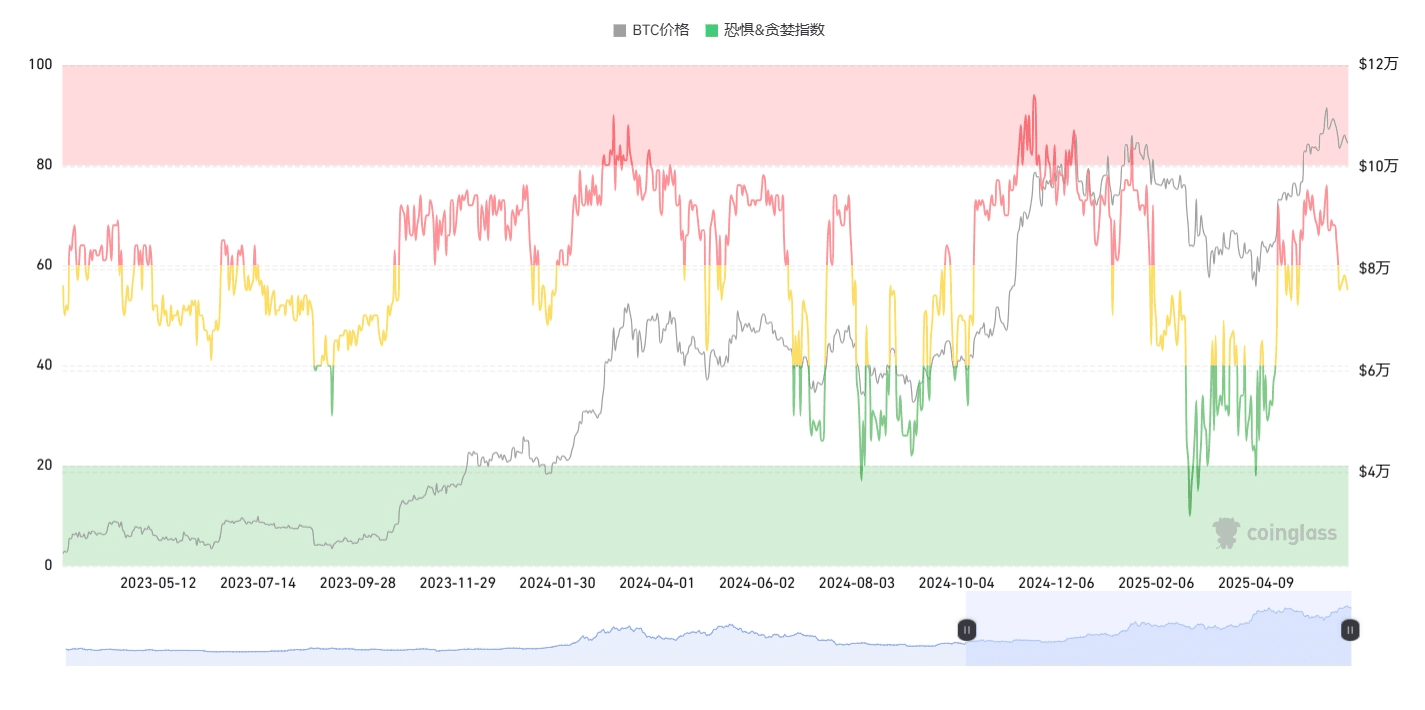
**Greed Panic/Greed Index interpretation.
Behavior in the cryptocurrency market is highly emotional. When the market is rising, people tend to be greedy, driven by the fear of missing out; when the market is falling, they irrationally react by selling their cryptocurrencies.
By leveraging the fear and greed index, we aim to help you minimize emotional factors and make rational judgments.
There are two states:
Extreme fear indicates that investors are overly worried, which may be a buying opportunity.
Excessive greed indicates that investors are overly excited, and the market may undergo a correction.
2. Bitcoin total market share 62.83 slightly increased from yesterday.
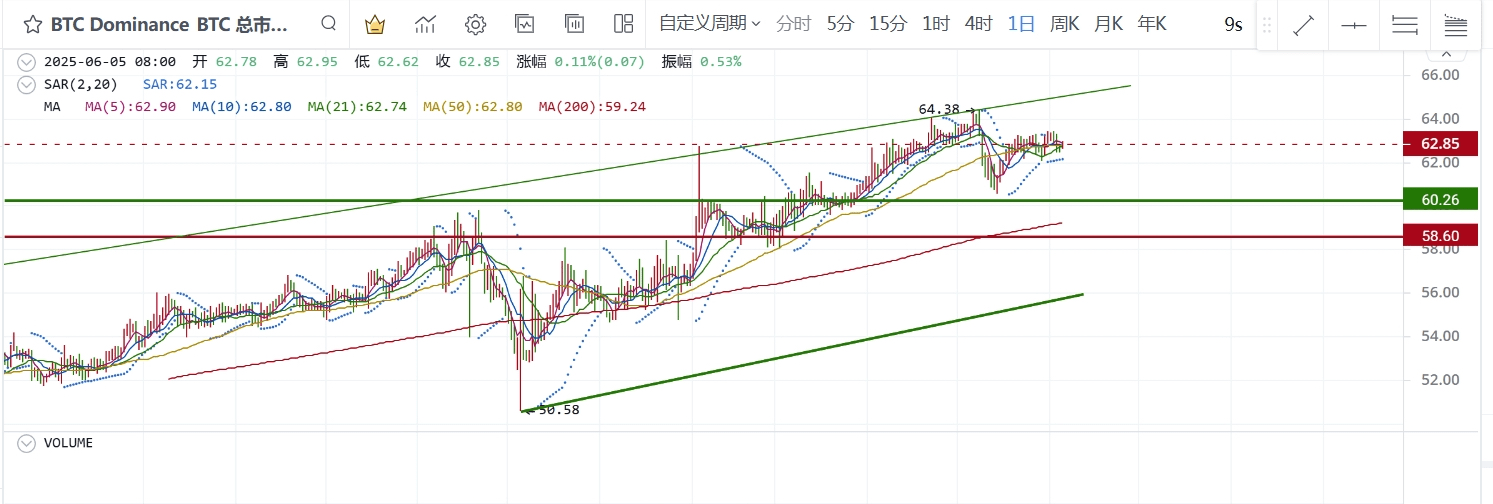
**Bitcoin total market share is a core indicator measuring Bitcoin's relative influence in the entire cryptocurrency market. This indicator not only reflects Bitcoin's short-term market position but also reveals changes in fund rotation, investor sentiment, and macro trends.
Bitcoin market share is a 'weather vane' for judging market phases:
Early bull market: market share rises, funds prioritize allocation to Bitcoin.
Late bull market: market share declines, funds rotate to altcoins, triggering 'altcoin season'.
Market thermometer: >60% = Risk aversion dominant; <40% = Altcoin frenzy period.
Capital flow diagram: reveals the allocation preferences of institutions versus retail (Bitcoin → stable, altcoins → high risk and high reward).
3. Bitcoin and Ethereum trading pair 0.024579 Ethereum against Bitcoin trading pair has slightly retreated.
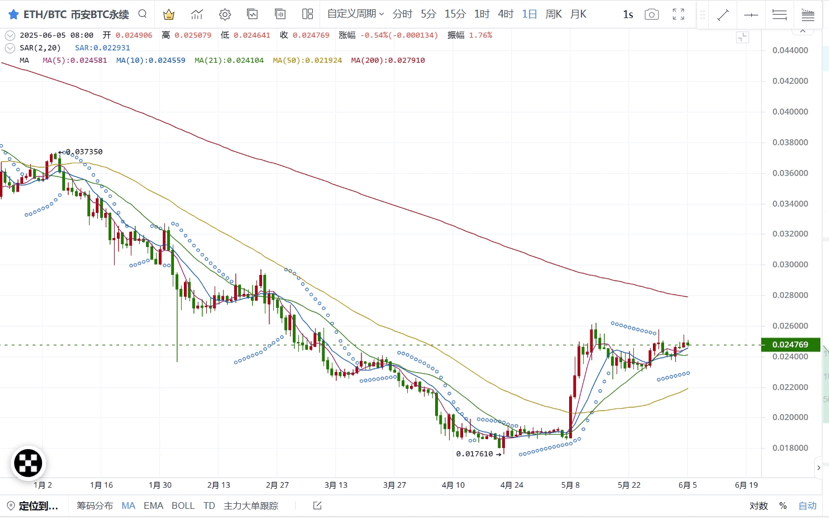
**The Bitcoin/Ethereum trading pair is the 'risk thermometer' of the cryptocurrency market:
Rising ratio → Market prefers high-risk assets (altcoin season initiation signal);
Declining ratio → Funds are seeking safety in Bitcoin (characteristics of bear market or early bull market).
4. ETF inflow and outflow data ETF data inflow speed has slowed, maintaining small inflow.
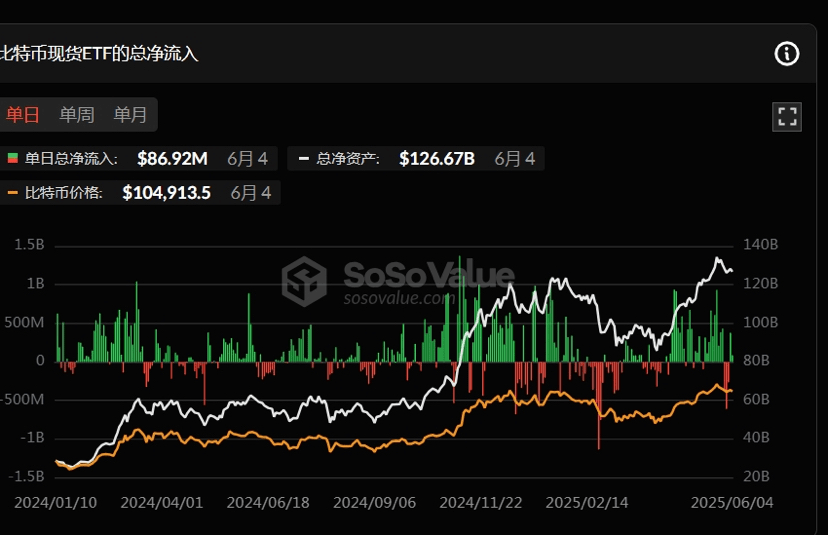
**ETF inflow and outflow data explanation: The inflow and outflow data of Bitcoin ETFs are core indicators that track institutional sentiment, market trends, and fund rotation.
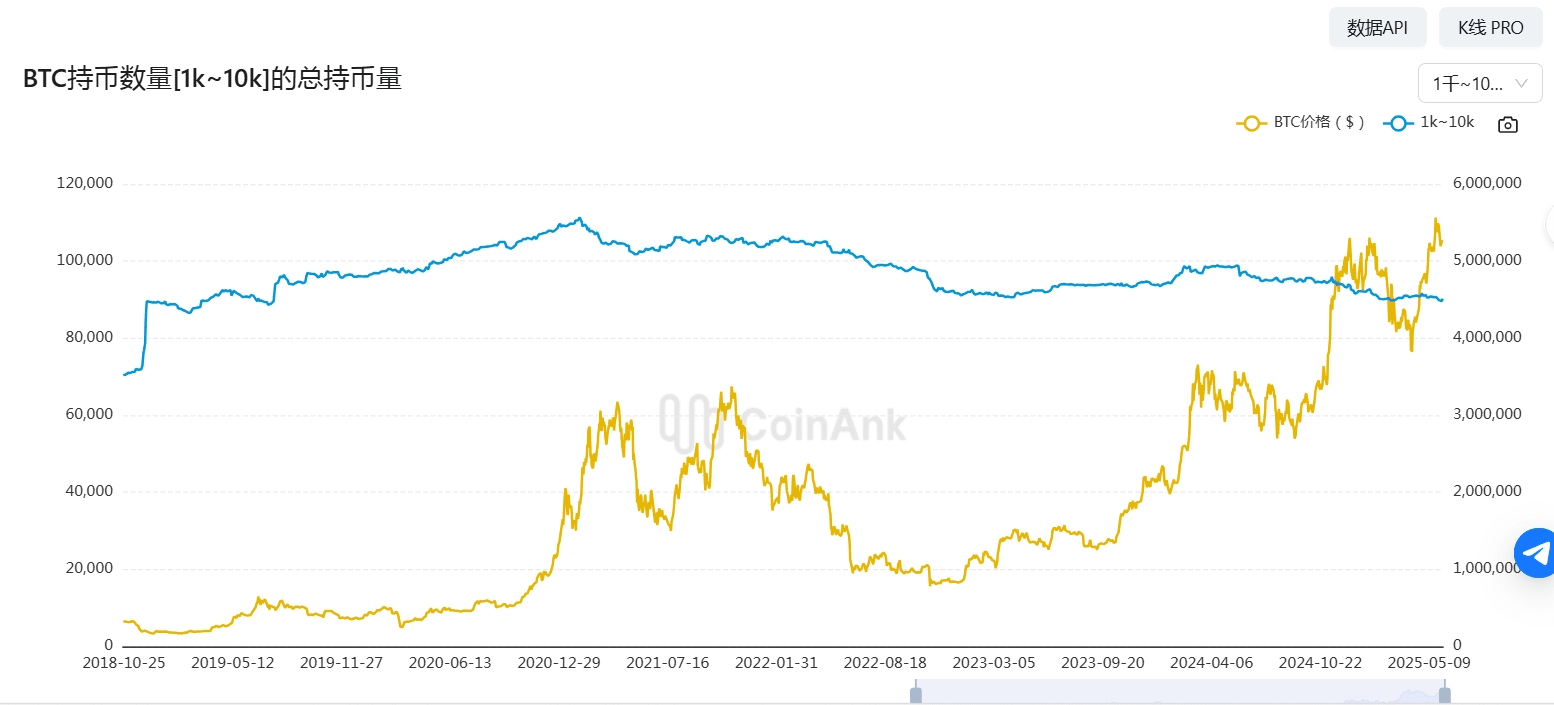
5. On-chain BTC retail, large holders, and institutions buying and selling data statistics. Large whales have continued to flow in small amounts for several days.
Thanks to @交易庞克大大 for providing data organization and sharing.
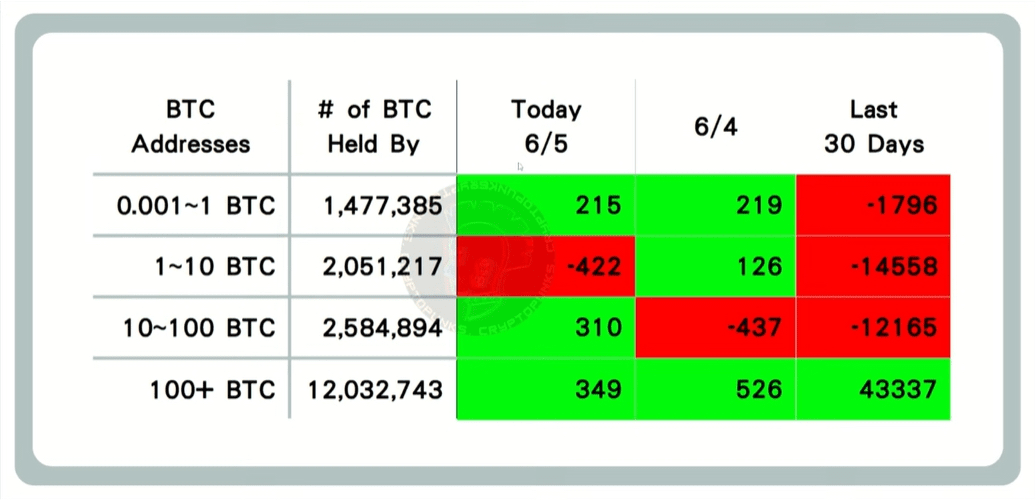
Data Explanation: Representing respectively ≤ 1 BTC, 1—10 BTC, 10—100 BTC, 100+ BTC changes in on-chain flow, this data can reflect a kind of market sentiment from retail investors, large holders, and institutions.
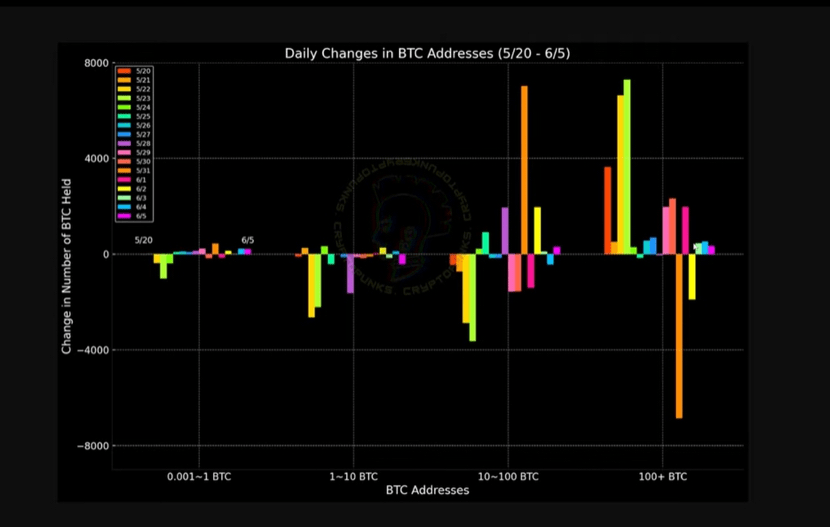
Data explanation: This data reflects the changes in on-chain flow of ≤ 1 BTC, 1—10 BTC, 10—100 BTC, and 100+ BTC within a week, which can intuitively reflect the BTC flow trends of retail investors, large holders, and institutions.
When on-chain data shows an extreme situation, a reversal often occurs (for example, if large whales holding over 100 BTC buy in large quantities while others are selling, the likelihood of Bitcoin rising greatly increases, and vice versa for a drop). This should be analyzed in conjunction with other on-chain data and technical indicators.
6. MVRV realized market capitalization ratio MVRV > 1
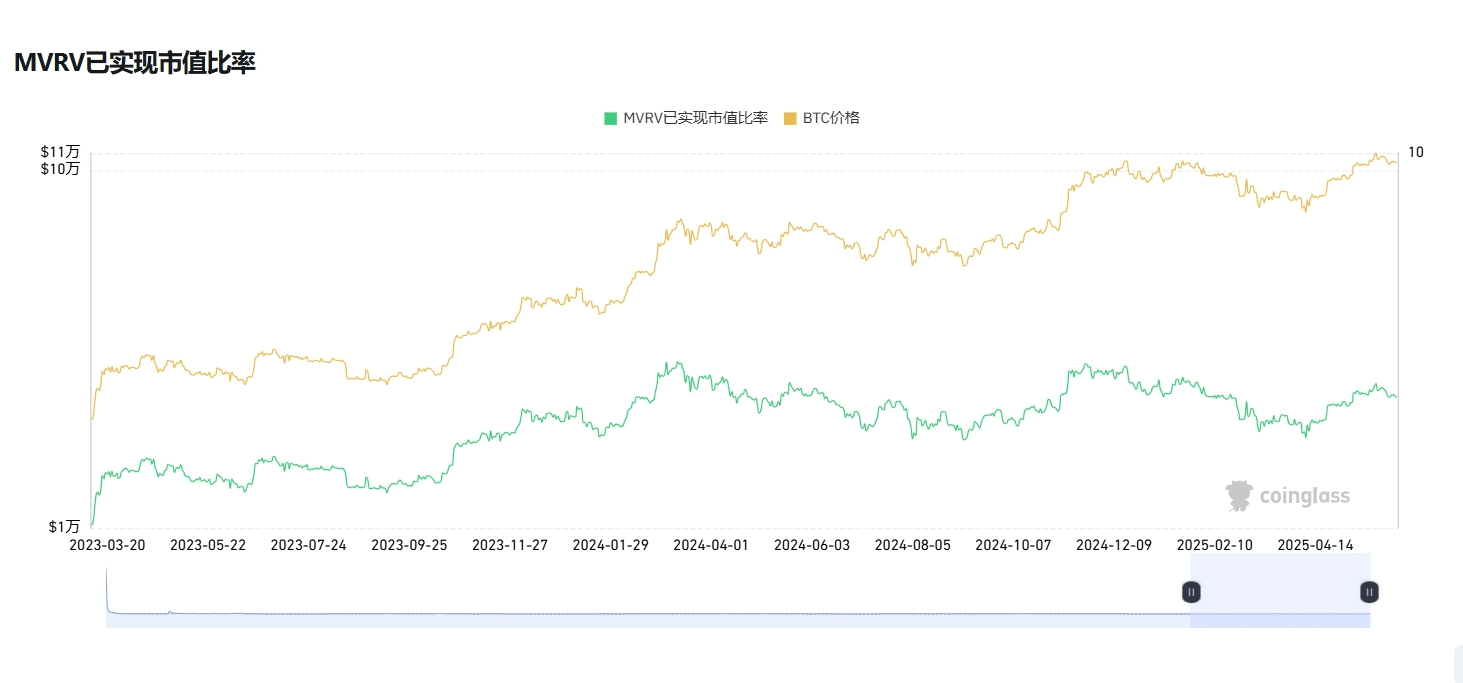
**MVRV realized market capitalization ratio indicator explanation: The MVRV realized market capitalization ratio is an indicator used to evaluate the cryptocurrency market (especially Bitcoin). This indicator can help you determine whether an asset is overvalued or undervalued and identify potential market tops and bottoms.
MVRV > 1
When the ratio is greater than 1, it indicates that market prices are higher than realized prices, meaning that most holders are in a profitable state. This may suggest that the market is overheating, especially when MVRV reaches historical highs, which could indicate a market top.
MVRV < 1
When the ratio is less than 1, it indicates that market prices are lower than realized prices, meaning that most holders are in a loss state. This may suggest that the market is undervalued, especially when MVRV reaches historical lows, which could indicate a market bottom.
7. Altcoin Season Index 14 Is it Altcoin season: No Continuous weakening.
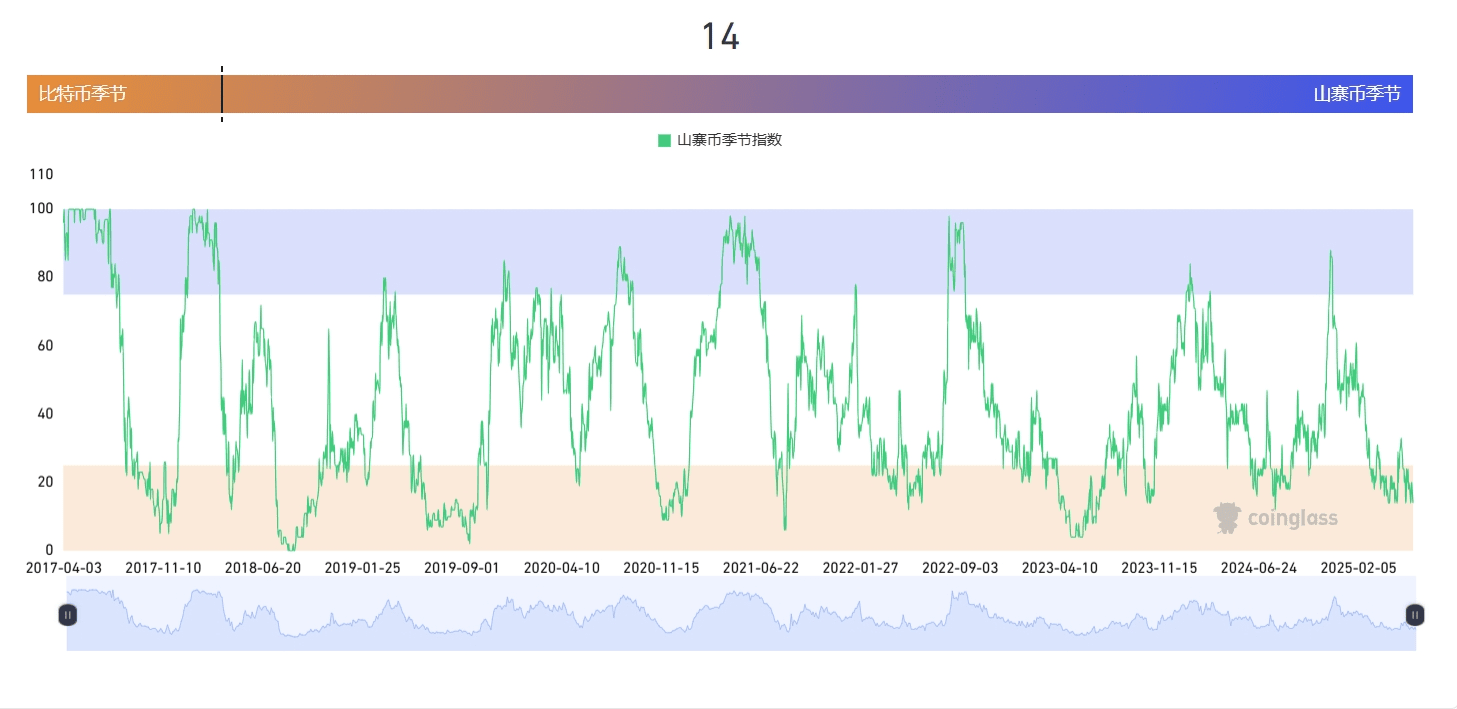
**Altcoin Season Index explanation: The Altcoin Season Index is an indicator used to measure the performance of non-Bitcoin cryptocurrencies in the cryptocurrency market. It is typically used to determine whether altcoins are performing better than Bitcoin over a specific time period, helping investors understand market trends and investment opportunities.
8. USD inflow into the cryptocurrency market Continuous net inflow.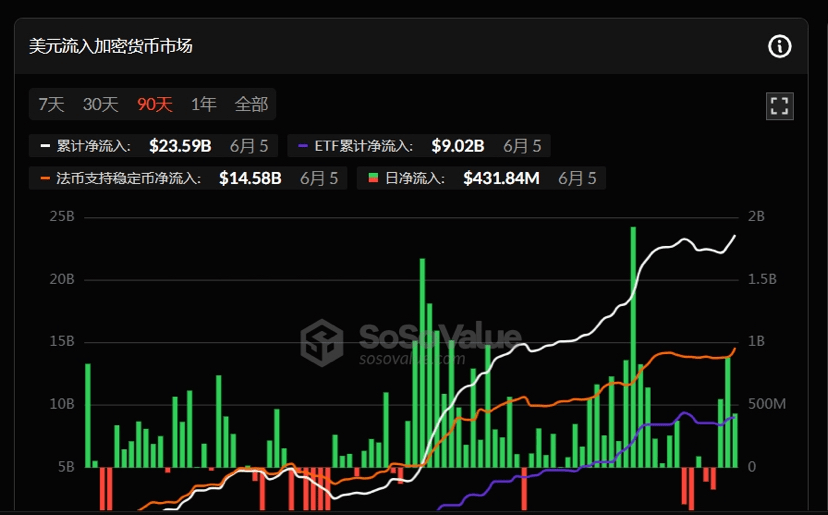
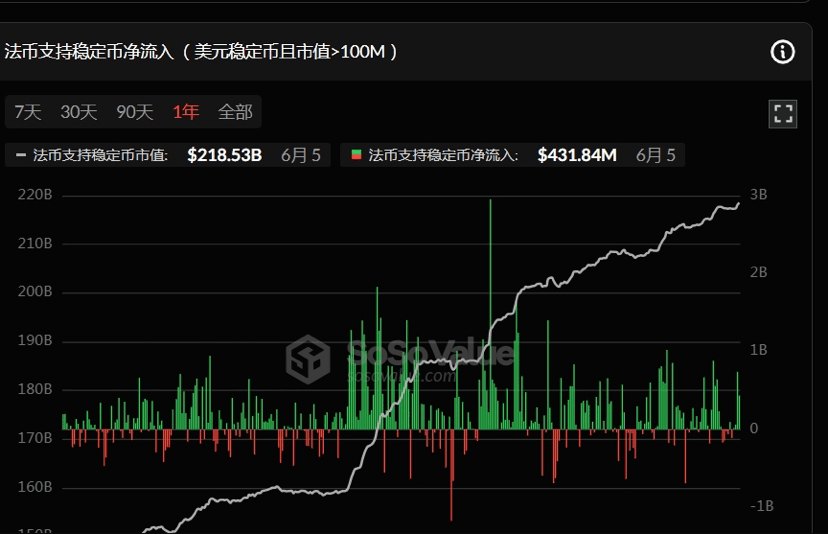
9. Net inflow of fiat-supported stablecoins (USD stablecoin with market cap > 100M) Net inflow.
The above data represents an assessment of BTC volatility trends and market sentiment from the perspective of on-chain data and does not constitute any investment advice. Please make careful decisions!

I am Mingzhu, follow me for daily sharing of real-time on-chain data and dynamics, helping you forecast decisions, don't miss out on the excitement, welcome to discuss in the comments.

