☘️ BTC Price: Spinning Between Political Storms and Oil Waves
Price Volatility:
BTC last week plummeted to near $103k amid escalating Middle Eastern tensions. After this drop, the price recovered around $105k – the current level.
What does the technical analysis show?
Hash Ribbon triggers a buy signal, BTC is likely to continue climbing to strong resistance zones of $112k – $119k if oil prices keep surging.
Support – resistance to pay attention to:
• Important support: ~$100k – strong buying pressure is needed to hold.
• Resistance: $112k (peak mid-May), further $119k if oil prices continue to rise.
☘️ Macroeconomics & news: Strong winds blowing BTC
The Middle East is tense like a guitar string:
Israel – Iran clash, capital fleeing from risk assets. Gold rises, BTC gets sold off heavily.
Weak USD:
USD has lost nearly 9% since the beginning of the year, BTC along with gold and stocks benefits, attracting more capital.
Regulations & institutions:
• The US Congress accelerates the GENIUS, CLARITY bills – increasing transparency for stablecoins.
• Amazon, Walmart, JPMorgan… quietly researching stablecoins – a long-term positive signal.
☘️ Next week: Up or down?
• If political tensions escalate (for example, if there are changes in the Strait of Hormuz), BTC easily drops to $100k – $103k.
• If the situation calms down + oil prices rise, BTC has a chance to break $112k – $119k.
• USD, gold, oil: closely monitor as they will guide capital flows.
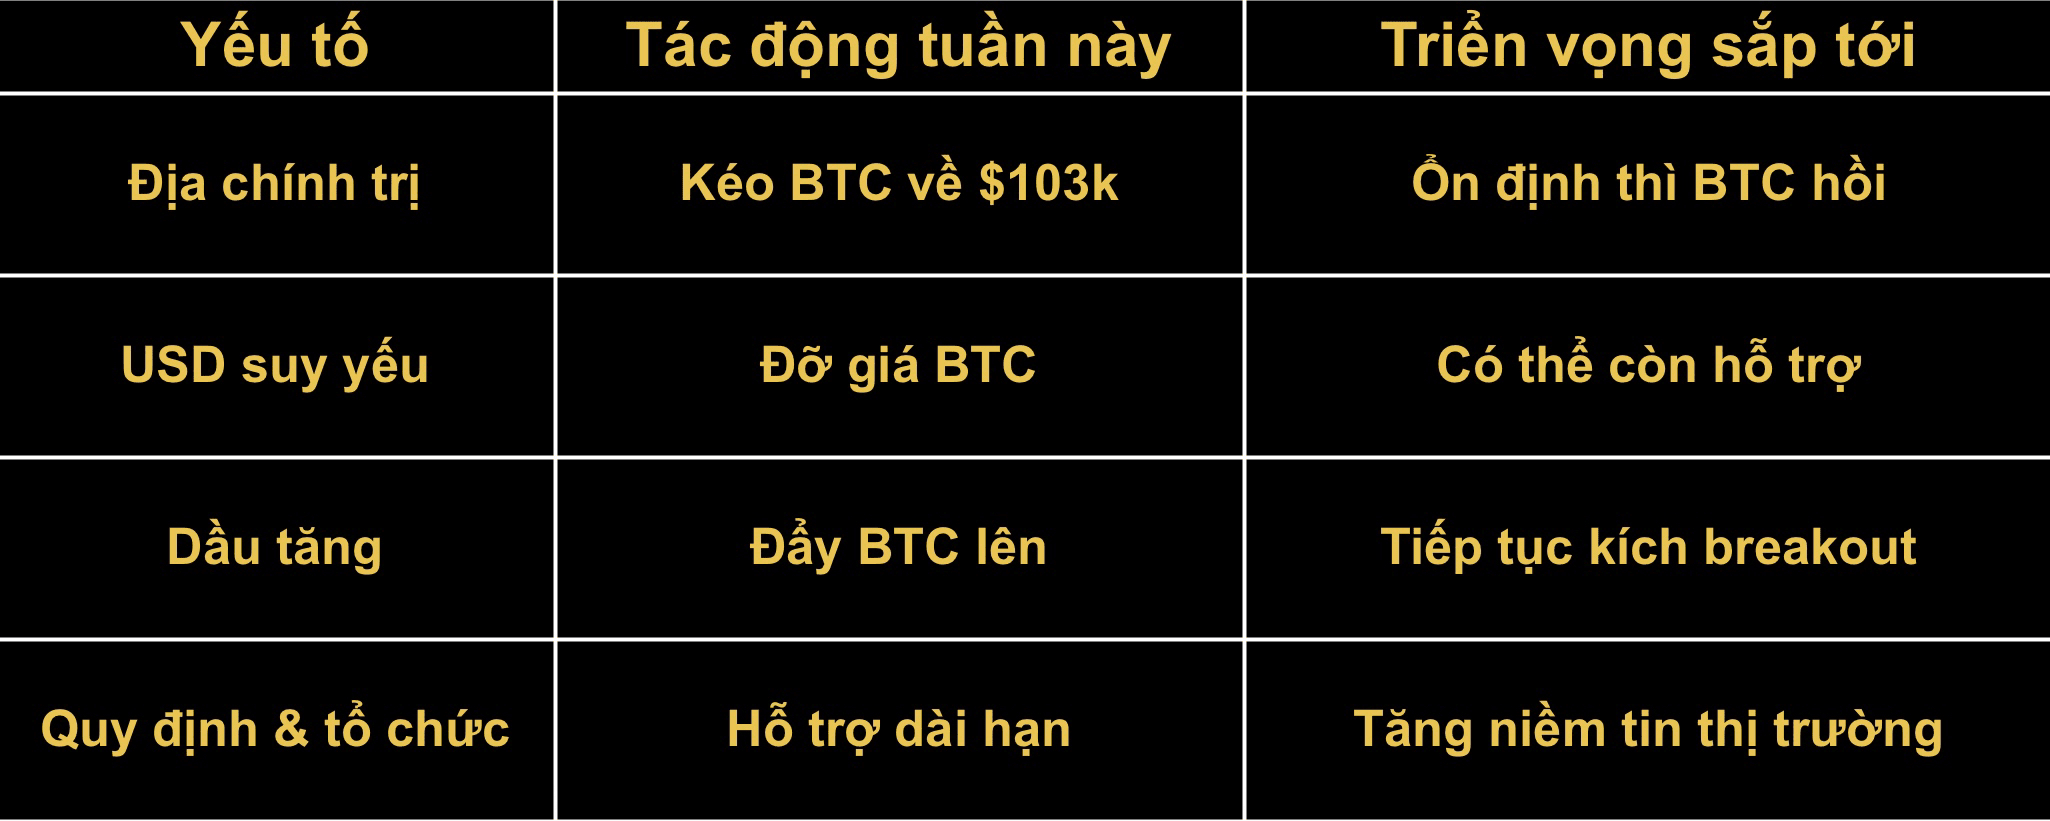
🍀 Summary
BTC this week has been weighed down by Middle Eastern conflicts, but still hovers around $105k thanks to a weak USD and institutional capital maintaining pace. Next week, the price depends on geopolitics and oil: if it worsens, test $100k, if it stabilizes, bounce back to $112k not far away.
Note: This is only an analytical perspective, not investment advice.
