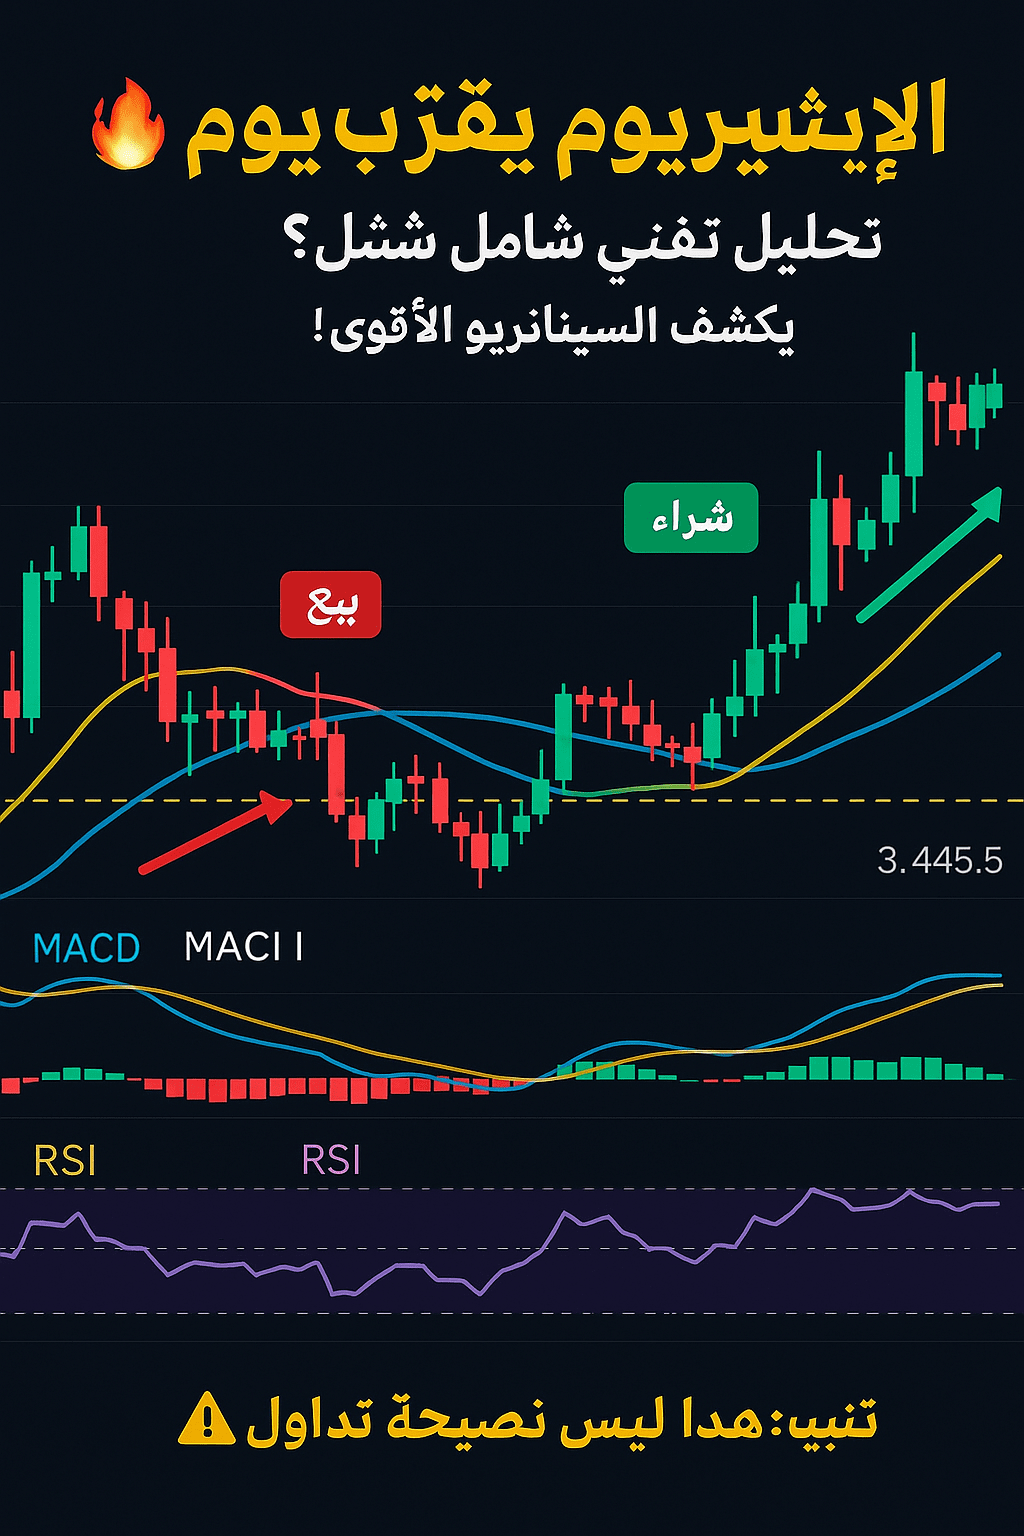
📌 Current price (approx from the chart): 3,445 USDT
🕐 Time frame: 1 Hour
⚙️ Type of analysis: Technical – Price Action + Indicators + Smart Levels
🔎 First: General context of the movement
Ethereum has been moving for 3 days in a narrow sideways channel between 3,375 and 3,475 USDT.
However, in recent hours, technical signals have emerged indicating an attempt to break the sideways trend, supported by increased trading volume and a return of positive momentum.
📊 Detailed technical analysis:
1. Candles and Price Action:
The last candle formed a "Bullish Engulfing" at the support 3,420 → Strong signal of institutional demand or smart liquidity.
The appearance of a long lower wick at 3,375 confirms a rejection of the downward movement.
2. Moving Averages:
MA(20) was recently broken upward → Signal of a bullish momentum start.
MA(50) is moving horizontally → Confirmation of horizontal trend consolidation.
The MA(9) crossing above the MA(21) → Support for short-term traders.
3. MACD Indicator:
Clear positive crossover.
The histogram is increasing → Start of a new momentum wave.
The fast line is moving away from the slow line → Evidence of accelerating the upward trend.
4. RSI Indicator:
RSI is currently at 62 (Unfilled ascending zone).
It hasn't reached 70 yet, indicating there is room for additional upside before entering overbought territory.
The RSI breaking the 60 level was an early signal for price rise.
🔐 Smart levels to watch:
Level Type Importance
3,375 Major support Major ascending bottom
3,420 Secondary support Bounced from it more than 3 times
3,475 Nearby resistance Current upper channel
3,520 Strong resistance Start of a new bullish rally
3,600 Potential target If it breaks 3,520 firmly
---
🎯 Suggested trading strategy:
Buy conditional on breaking 3,475 with a strong candle + high trading volume.
Targets:
3,520 (First target)
3,600 (Second target)
Stop loss: below 3,420 (or flexible according to your style)
⚠️ Risks to be aware of:
Bitcoin's volatility may pull the entire market in any direction.
The RSI indicator nearing the overbought area may precede a short correction movement.
Unexpected news (especially regulatory or from the US Federal Reserve) can reverse the trend.
💬 Conclusion of the analysis – Are we witnessing ETH's breakout tonight?
> It seems that Ethereum is preparing for a big move… the only question is: Will it come now or after a final test of support?
Smart decisions come with clear signals, not with emotions!
✍️ Share your opinion:
Do you see ETH capable of breaking the 3,500 barrier this week?
👇 Write to us in the comments, and don't forget to share the analysis with crypto-interested followers.

#Ethereum #BinanceAlphaAlert #BTC110KToday? #BinanceTGEXNY #BinanceHODLerSAHARA