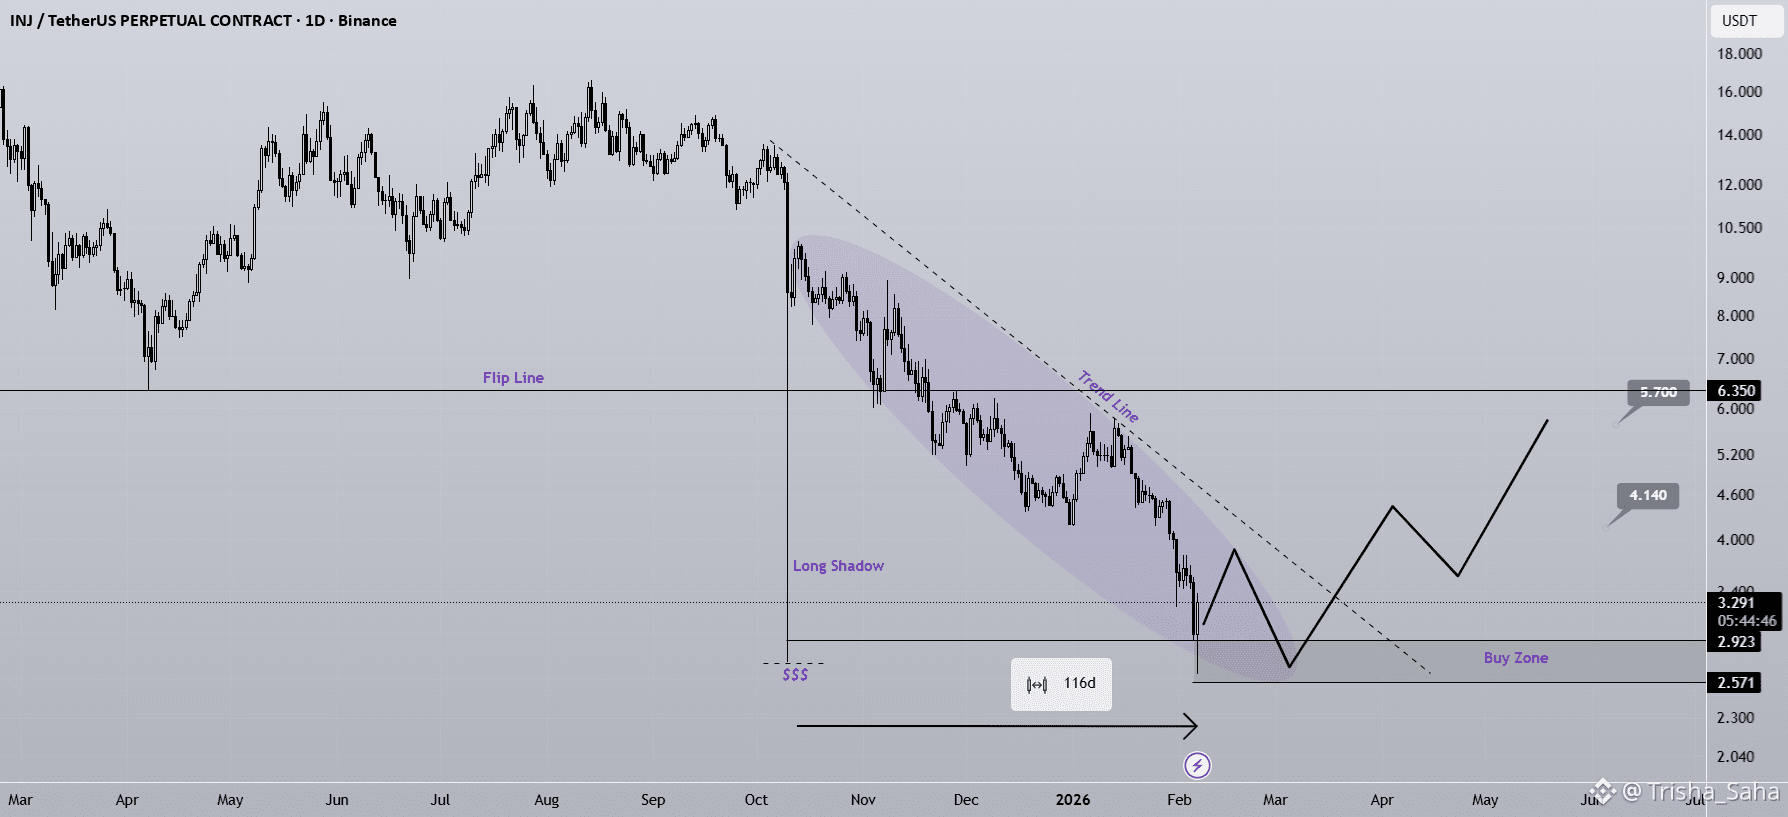
On the INJ chart, we can clearly see a large long shadow (wick) that has been barely filled. These long shadows often act like price gaps on the chart, meaning the market tends to revisit them in the future to complete unfinished price action. This makes them very important zones for future reactions.
The price movement that filled this long shadow is highlighted with a purple ellipse on the chart. This process took more than 116 days, showing how significant and time-consuming this correction was. During this period, the market successfully hunted the liquidity at the bottom of this major long shadow, which often signals the completion of a deep accumulation or manipulation phase.
Now, if the price starts to pull back again, we expect strong support to form between the long shadow of the 12-hour candle and the larger long shadow area. This zone represents a high-probability demand area and is considered our main buying region.
This support range has strong technical importance and aligns with smart money concepts, liquidity sweeps, and unfinished price zones. If buyers defend this area, we can expect a continuation of the bullish trend.
It is important to take advantage of this opportunity in the right direction and follow proper risk management. Entering near strong support gives us a favorable risk-to-reward ratio and increases the probability of a successful trade.
The price targets and potential resistance levels are clearly marked on the chart, allowing traders to plan their entries, stop-loss levels, and take-profit zones in advance.
Always remember: patience, discipline, and confirmation are key to long-term success in trading.
If you would like us to analyze a coin or altcoin for you, first like this post, then comment the name of your altcoin below.