Key Fibonacci Application to This Chart
To apply Fibonacci properly, we select major swing points from the visible chart:
• Swing Low ≈ 0.055590 USDT (the consolidation bottom/low point labeled on the chart, near the major dip).
• Swing High ≈ 0.135544 USDT (the recent 24-hour high after the breakout pump).
The current price (~0.120033 USDT) sits in the upper portion of this move, post-breakout from consolidation.
Levels (Potential Pullback/Support Zones)
These levels indicate where price might retrace during corrections in the ongoing upmove:
• 23.6% retracement ≈ 0.117–0.118 USDT (minor support; price is currently above this, showing strength).
• 38.2% retracement ≈ 0.105–0.108 USDT (key zone; aligns closely with the recent pullback area ~0.10442 and near MA99 support).
• 50.0% retracement ≈ 0.095–0.097 USDT (psychological midpoint; strong confluence with prior resistance-turned-support and volume clusters).
• 61.8% retracement ≈ 0.085–0.088 USDT (golden ratio; deep pullback zone, near MA25/MA7 cluster ~0.082–0.087).
• 78.6% retracement ≈ 0.072–0.075 USDT (aggressive correction; near the breakout base ~0.07120).If the price pulls back, these levels (especially 38.2%–61.8%) often act as dynamic support where buyers step in, particularly with the bullish volume surge.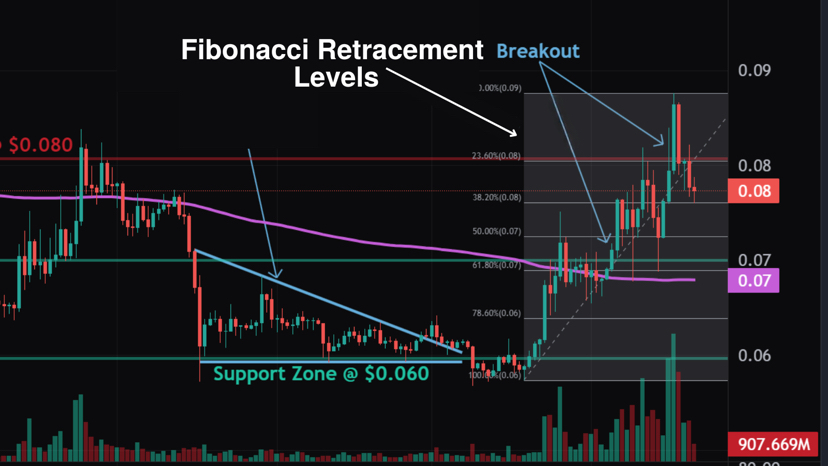
These images illustrate typical Fibonacci retracement setups on candlestick charts (similar to INITUSDT’s 15m/1h view). Note how price often respects 38.2%, 50%, and 61.8% during healthy pullbacks in uptrends.
Extension Levels (Potential Upside Targets)
For continuation targets after the breakout, use Fibonacci extensions (projecting from the swing low to high, then extending beyond):
• 127.2% extension ≈ 0.145–0.150 USDT (near-term target; slight extension beyond the 24h high).
• 161.8% extension ≈ 0.165–0.175 USDT (common in strong pumps; golden ratio target).
• 200% extension ≈ 0.190–0.200 USDT (aggressive if momentum sustains).
• 261.8% extension ≈ 0.220+ USDT (longer-shot in euphoric moves).
The recent +65% pump aligns with breaking out of consolidation toward these extension levels.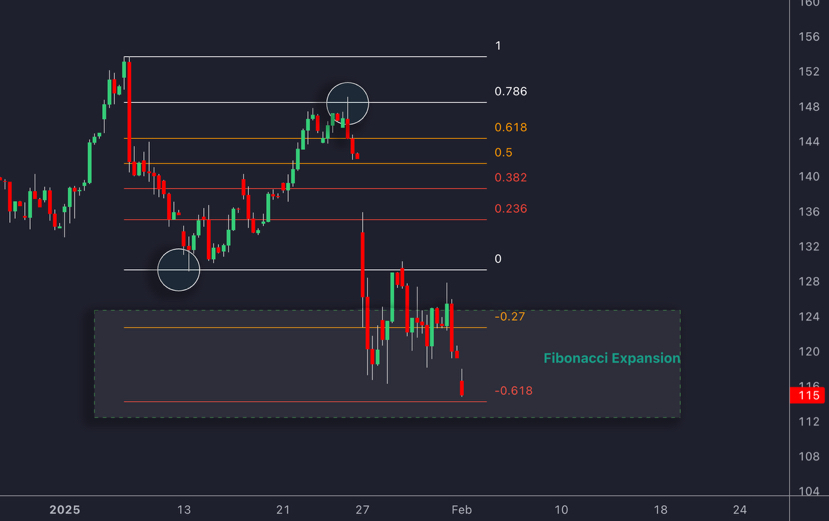
These show Fibonacci extension examples on breakout charts, where price projects upward from the prior range (similar to INIT’s move from ~0.055–0.07 base to current levels).
Updated Predictions with Fibonacci Confluence
• Short-Term (1–7 days): 75% probability of continuation toward 0.145–0.165 (127.2%–161.8% extensions) if holds above 0.104–0.108 (38.2% retracement). 25% chance of deeper pullback to 0.085–0.095 (50%–61.8%) for healthy consolidation before next leg up.
• Medium-Term (1–3 months): If the breakout sustains (e.g., holds above 61.8% on any dip), targets 0.20+ possible (higher extensions). Bearish invalidation below 0.07120 (full retracement to 100%).
Updated Trading Strategies with Fibonacci
• Long Bias: Enter/add on dips to 38.2%–50% retracement zones (~0.105–0.097) with confirmation (e.g., green candle + volume). Stop-loss below 61.8% (~0.085) or the breakout base (0.071).
• Take Profits: Partial at 127.2% (~0.145), major at 161.8% (~0.165–0.175). Trail stops using 23.6% or recent swing lows.
• Risk Management: Use Fibonacci clusters for better R:R (e.g., risk below 61.8% for targets at 161.8% = strong ratio).
These levels add confluence to the prior MA/volume analysis—watch for reactions at them. Always verify on your platform (e.g., draw Fib tool from low 0.05559 to high 0.13554 on TradingView/Binance). Crypto remains volatile; combine with news and broader market context. Trade responsibly!#MarketRebound #CPIWatch #Binance #BTC走势分析 #btc70k