
📰 Daily Market Update:
Stablecoins are the lifeblood of crypto markets — they fuel buying, signal sentiment, and often hint at what’s coming next.
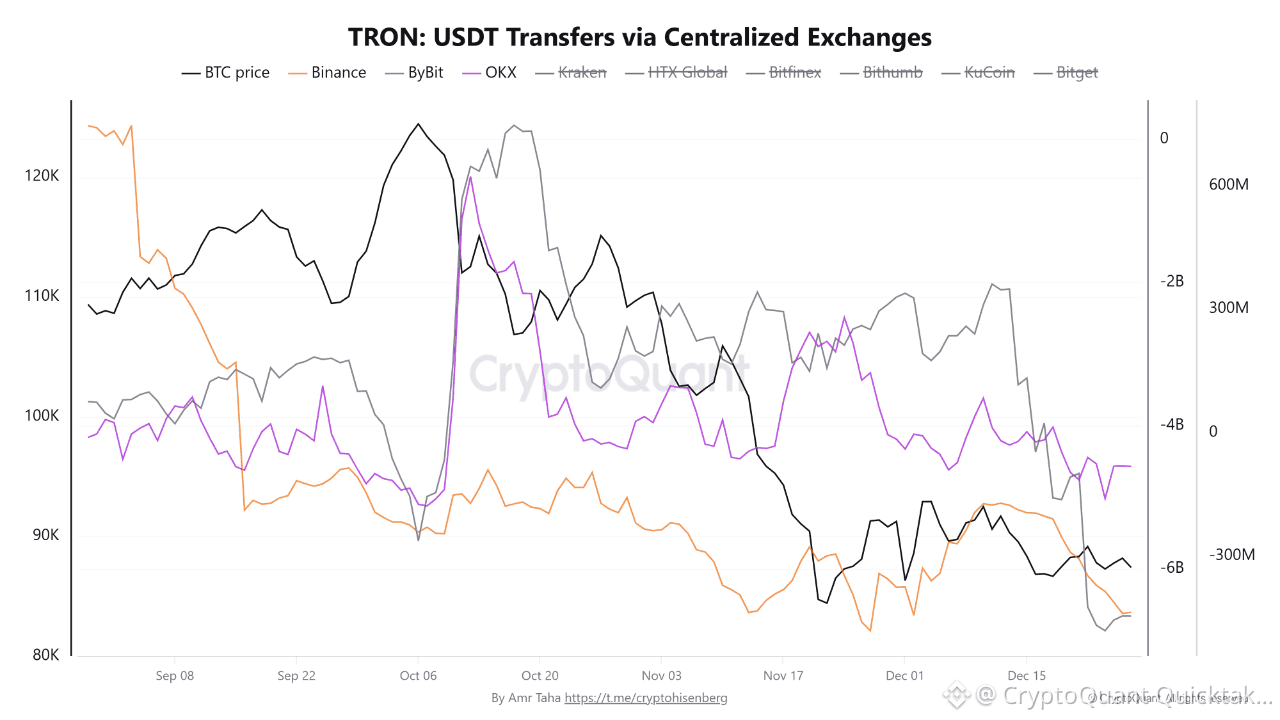
📊 TRON: USDT Transfers via Centralized Exchanges
* This chart tracks USDT transfers on the TRON (TRC20) network across major centralized exchanges.
* When USDT balances on exchanges are rising , this usually means buying power is ready, which is positive for BTC and the market overall.
* When USDT balances are falling , it signals liquidity leaving the market, either being withdrawn to cold wallets or rotated away after spot selling. This is usually bearish or at least shows weak demand.
⚠️ It’s important to note that TRON network is heavily used for USDT withdrawals, especially after:
* Bitcoin spot selling
* Partial exits
* Risk reduction phases
🔍 Key observation:
Starting from December 10, USDT balances on Binance, Bybit, and OKX have been declining clearly on the TRON network only, which strongly suggests capital outflows rather than preparation for buying.
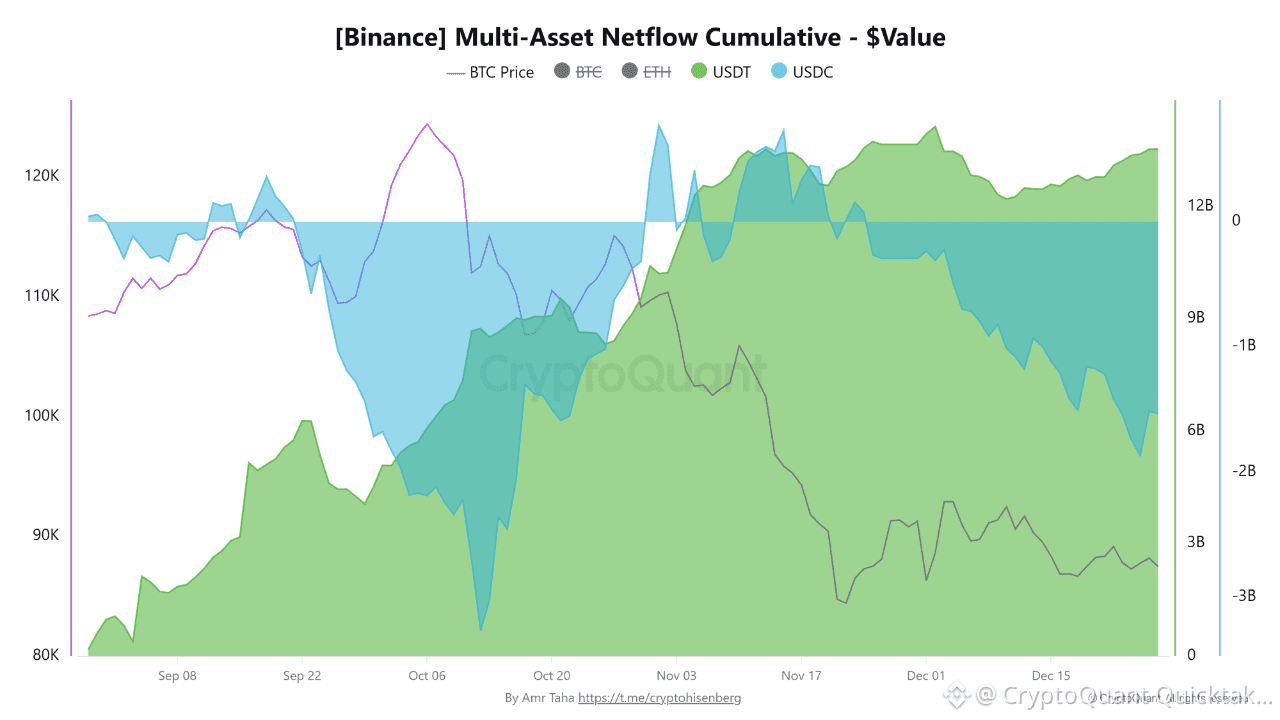
📊 [Binance] Multi-Asset Netflow Cumulative – $Value
This chart shows the cumulative netflow of multiple assets on Binance, mainly USDT and USDC.
* USDT balances on Binance have been steadily increasing since September, reaching around $13.5B.
* On the other side, USDC balances dropped by roughly $2B
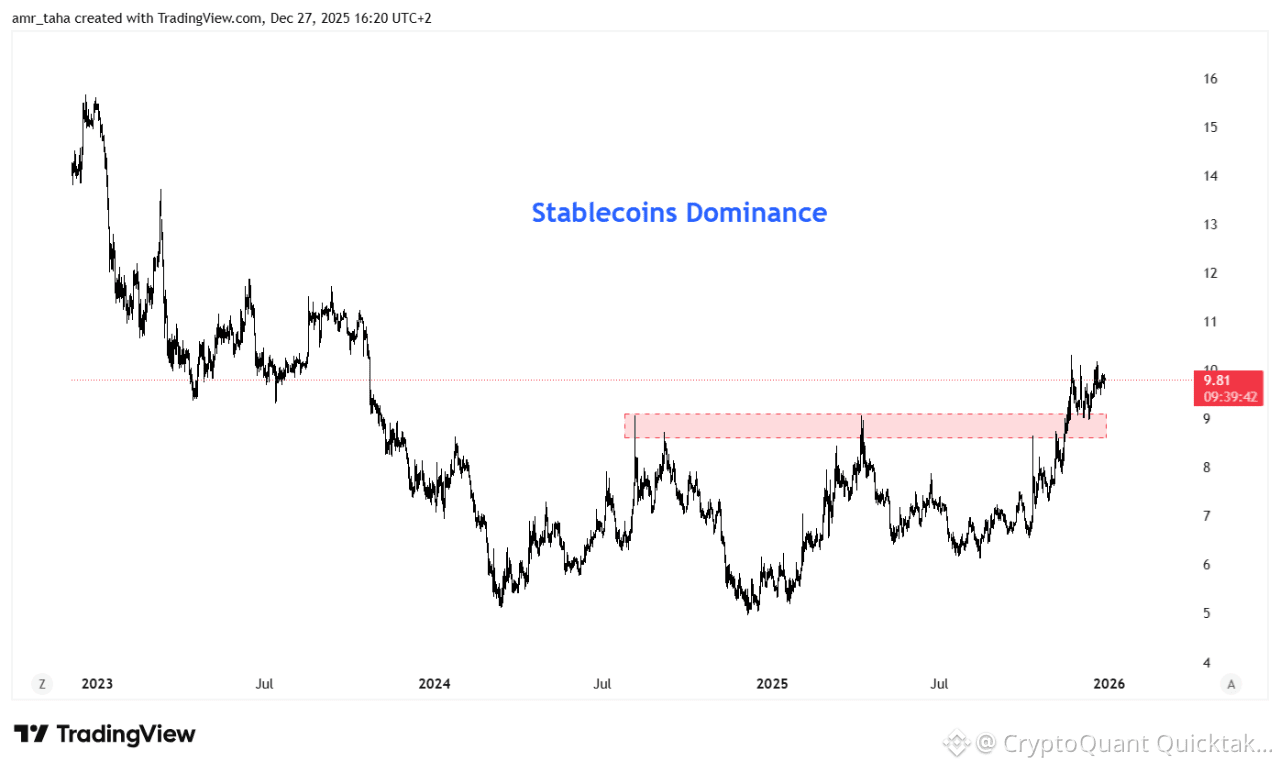
📊 Stablecoins Dominance
The Stablecoins Dominance chart measures the percentage of stablecoins compared to the total crypto market.
* Rising dominance → more selling than buying
* Falling dominance → capital rotating into crypto assets
📌 Since mid-November, stablecoins dominance has broken above 9% and stayed stable above this level.
This tells us something very clear:
* Selling pressure is still present
* Buyers are not stepping in aggressively yet
* Market participants prefer staying liquid and cautious
🧠 Conclusion
Monitoring stablecoin inflows and outflows gives a very deep insight into what the market is really doing, not what price alone is showing.
Written by Amr Taha

