Hey crypto community!🤗Analyzing the XRP/USDT chart on Binance right now (as of Jan 17, 2026, around 12:13 PM +06 from Dhaka). The pair is trading at ~2.0535, down-1.01% in the last 24h, with a 24h high of 2.0866 and low of 2.0263. Volume is solid at 61.52M XRP and 126.69M USDT. The chart shows some consolidation after a volatile ride from Oct 2025 to mid-2026. Let's break down the shot (short) entry zone and long entry zone based on the visible patterns, trendlines, and support/resistance levels. Remember, this is not financial advice-DYOR and trade responsibly!📊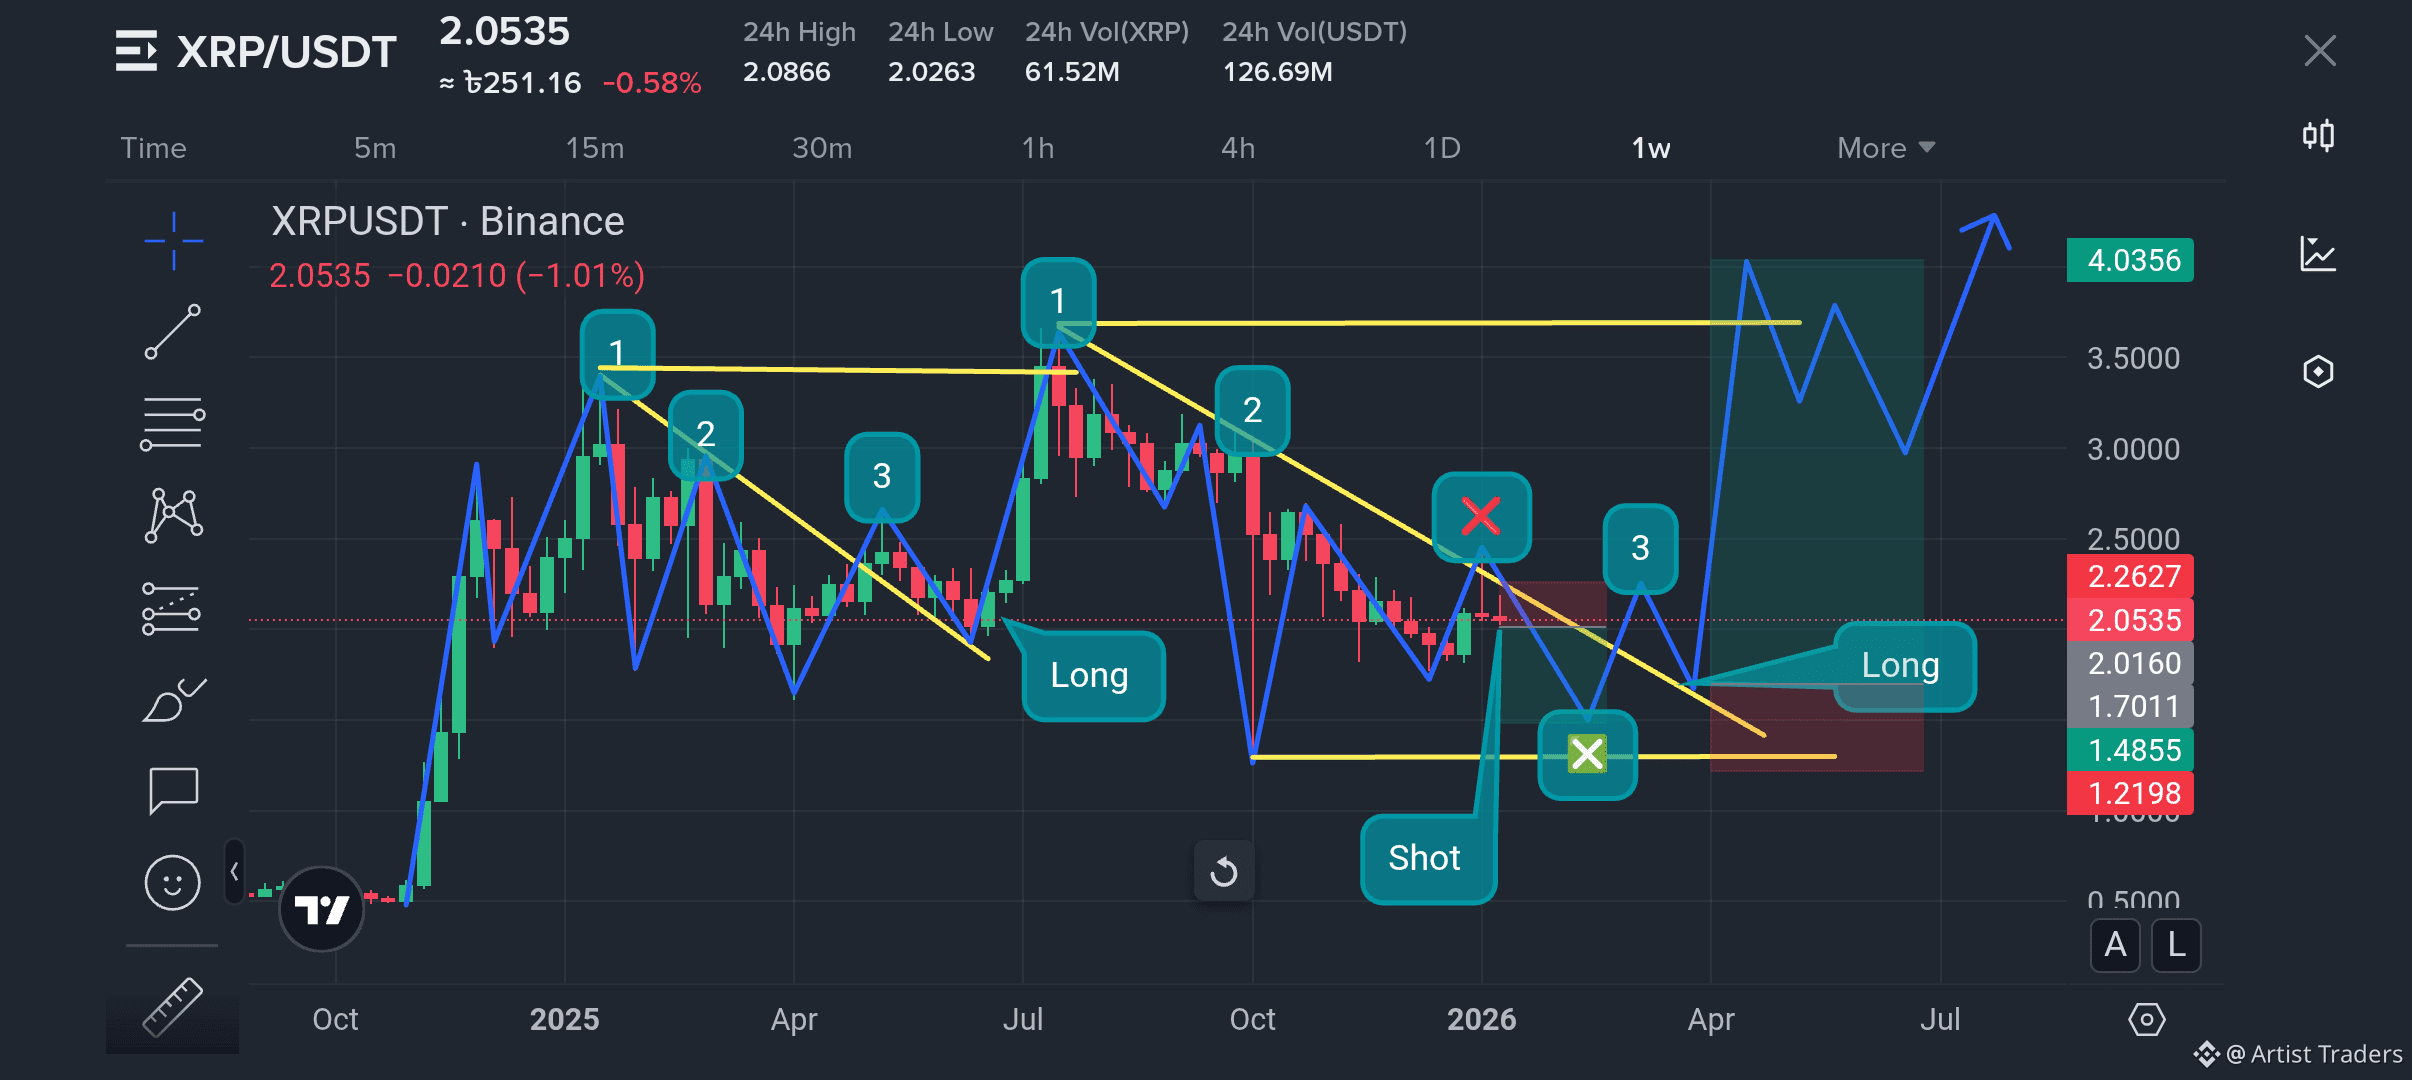
📉Short Entry Zone (Bearish Setup)
The chart highlights a potential short opportunity around the current price action. Here's the breakdown:
Key Resistance Level: Look at those yellow horizontal lines(labeled 1) around 2.085-2.086. This seems to be a strong resistance where price has rejected multiple times recently. The descending trendline from the recent high (around 2.09 in early 2026) is sloping down, connecting points 2 and 3 on the chart.
Entry Zone: Ideal short entry between 2.05-2.08. Wait for a rejection off the upper yellow line or a break below the blue descending channel. The red "X" markers and the "Short" button suggest bearish momentum if we see a close below 2.03 (24h low).
Stop-Loss (SL): Place above the recent high at ~2.09 to protect against a fakeout upside.
Take-Profit (TP) Targets:
TP1: 2.026 (24h low) - Quick scalp for +1-2%.
TP2: 1.98-2.00 - Deeper support from the lower green zone.
Risk-Reward: Aim for 1:2 or better, given the downtrend slope.
Why short here? The candlestick patterns show bearish engulfing
near point 3, and the overall channel is tilting down. If we break below 2.00, it could accelerate towards 1.71 (visible lower support). Volume spike on downsides supports this bearish bias. Watch for BTC correlation too! ⛔
📈Long Entry Zone (Bullish Setup)
On the flip side, there's a solid long setup forming if we get a bounce. The chart has green "Long" labels pointing to potential reversal zones.
Key Support Level: The lower horizontal lines (around
2.00-2.01) and the ascending trendline from Oct 2025 lows (connecting points 1 and the green upward arrow) act as strong support. Price is hovering near 2.0535, with the 50-period MA providing a floor.
Entry Zone: Enter long on a bounce from 2.01-2.05. Confirm with a bullish candle close above the blue ascending channel or the green "Long" bubble near 2.016. The chart's upward green lines from mid-2025 suggest building momentum.
Stop-Loss (SL): Below the recent low at ~1.98 to avoid downside breaks.
Take-Profit (TP) Targets:
TP1: 2.385 (resistance break) - For +20-30% gains.
TP2: 2.56-2.57 (next green zone) - Higher resistance from April 2026.
TP3: 2.80+ if we smash through - Bullish if volume picks up.
Why long here? The chart shows higher lows forming (e.g., from 1.71 in late 2025), and the green volume bars indicate accumulation. If XRP news (like Ripple updates) hits, we could see a pump. The "Long" annotations and upward arrows scream reversal potential!💫
Overall Market Sentiment & Tips
Timeframe: This analysis is on a 4H-1D view, but zoom into
15M-1H for precise entries. The broader trend from 2025 shows XRP in a multi-month uptrend, but short-term correction possible.
Indicators: RSI might be oversold near supports (check your platform). MACD could cross bullish for longs.
Risk Management: Never risk more than 1-2% per trade.
Current volatility is moderate, but news can swing it wild (e.g., regulatory stuff for XRP).
Watchlist: Key levels - Support: 2.00, 1.98 | Resistance: 2.08, 2.26.
What do you think, fam? Bullish on XRP or waiting for a dip? Drop your thoughts below! If you're in Dhaka like me (or nearby), let's discuss over some local crypto vibes. #xrp #cryptotrading
