
Here’s a short, brutally honest BNB candle-chart analysis — no hype, no blind optimism.


---
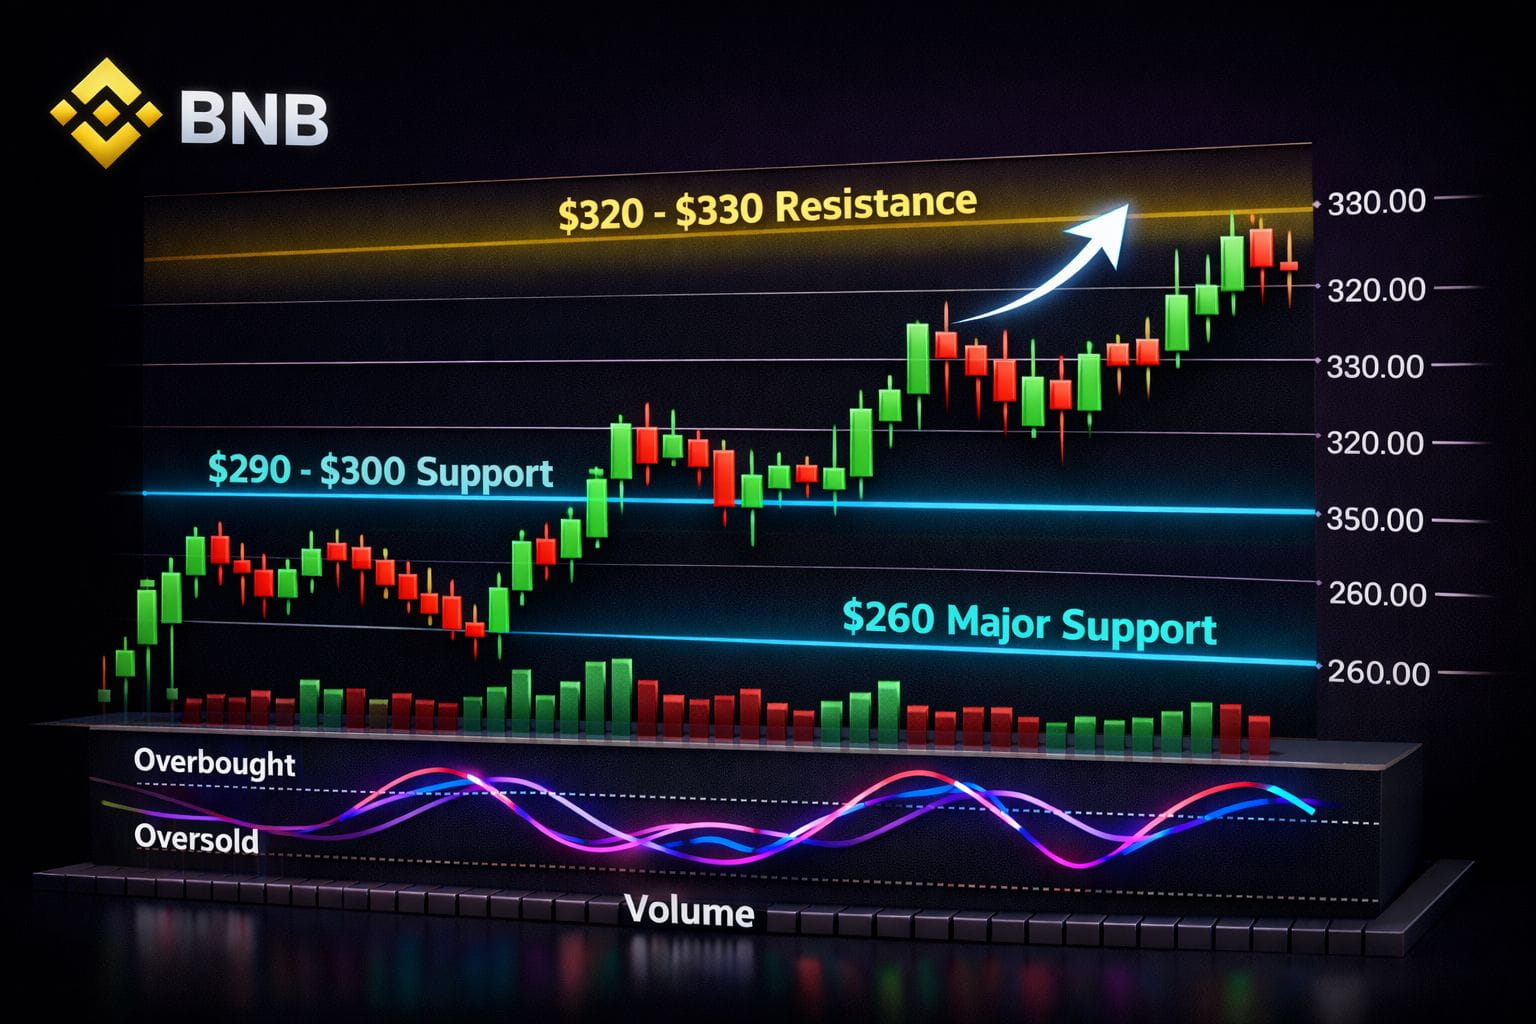
BNB Candle Chart Analysis (Short & Real)
BNB is range-bullish, not in a clean breakout yet.
Trend: Still holding a higher-low structure, but momentum is slowing. This is not a chase zone.
Key resistance: ~$320–$330
Multiple candles show upper wicks here → sellers are active. Until a strong close above resistance, upside is capped.
Key support: ~$290–$300
This is the line that matters. Bulls must defend it. A clean breakdown turns this into a distribution range, not accumulation.
Major support: ~$260
Lose this and the medium-term bullish structure breaks. No debate.
Candlestick behavior:
Small bodies + wicks = indecision
That means smart money is waiting, not rushing in
Momentum reality:
Indicators are neutral → no strong impulse
Breakouts without volume here are fake more often than real
---
Reality Check
Above ~$330 with volume → real bullish continuation
Rejection at resistance → sideways chop or pullback
Below ~$290 → weakness, not “healthy dip”
If you’re buying BNB here expecting instant upside, you’re early or wrong. Wait for confirmation or accept drawdown risk.