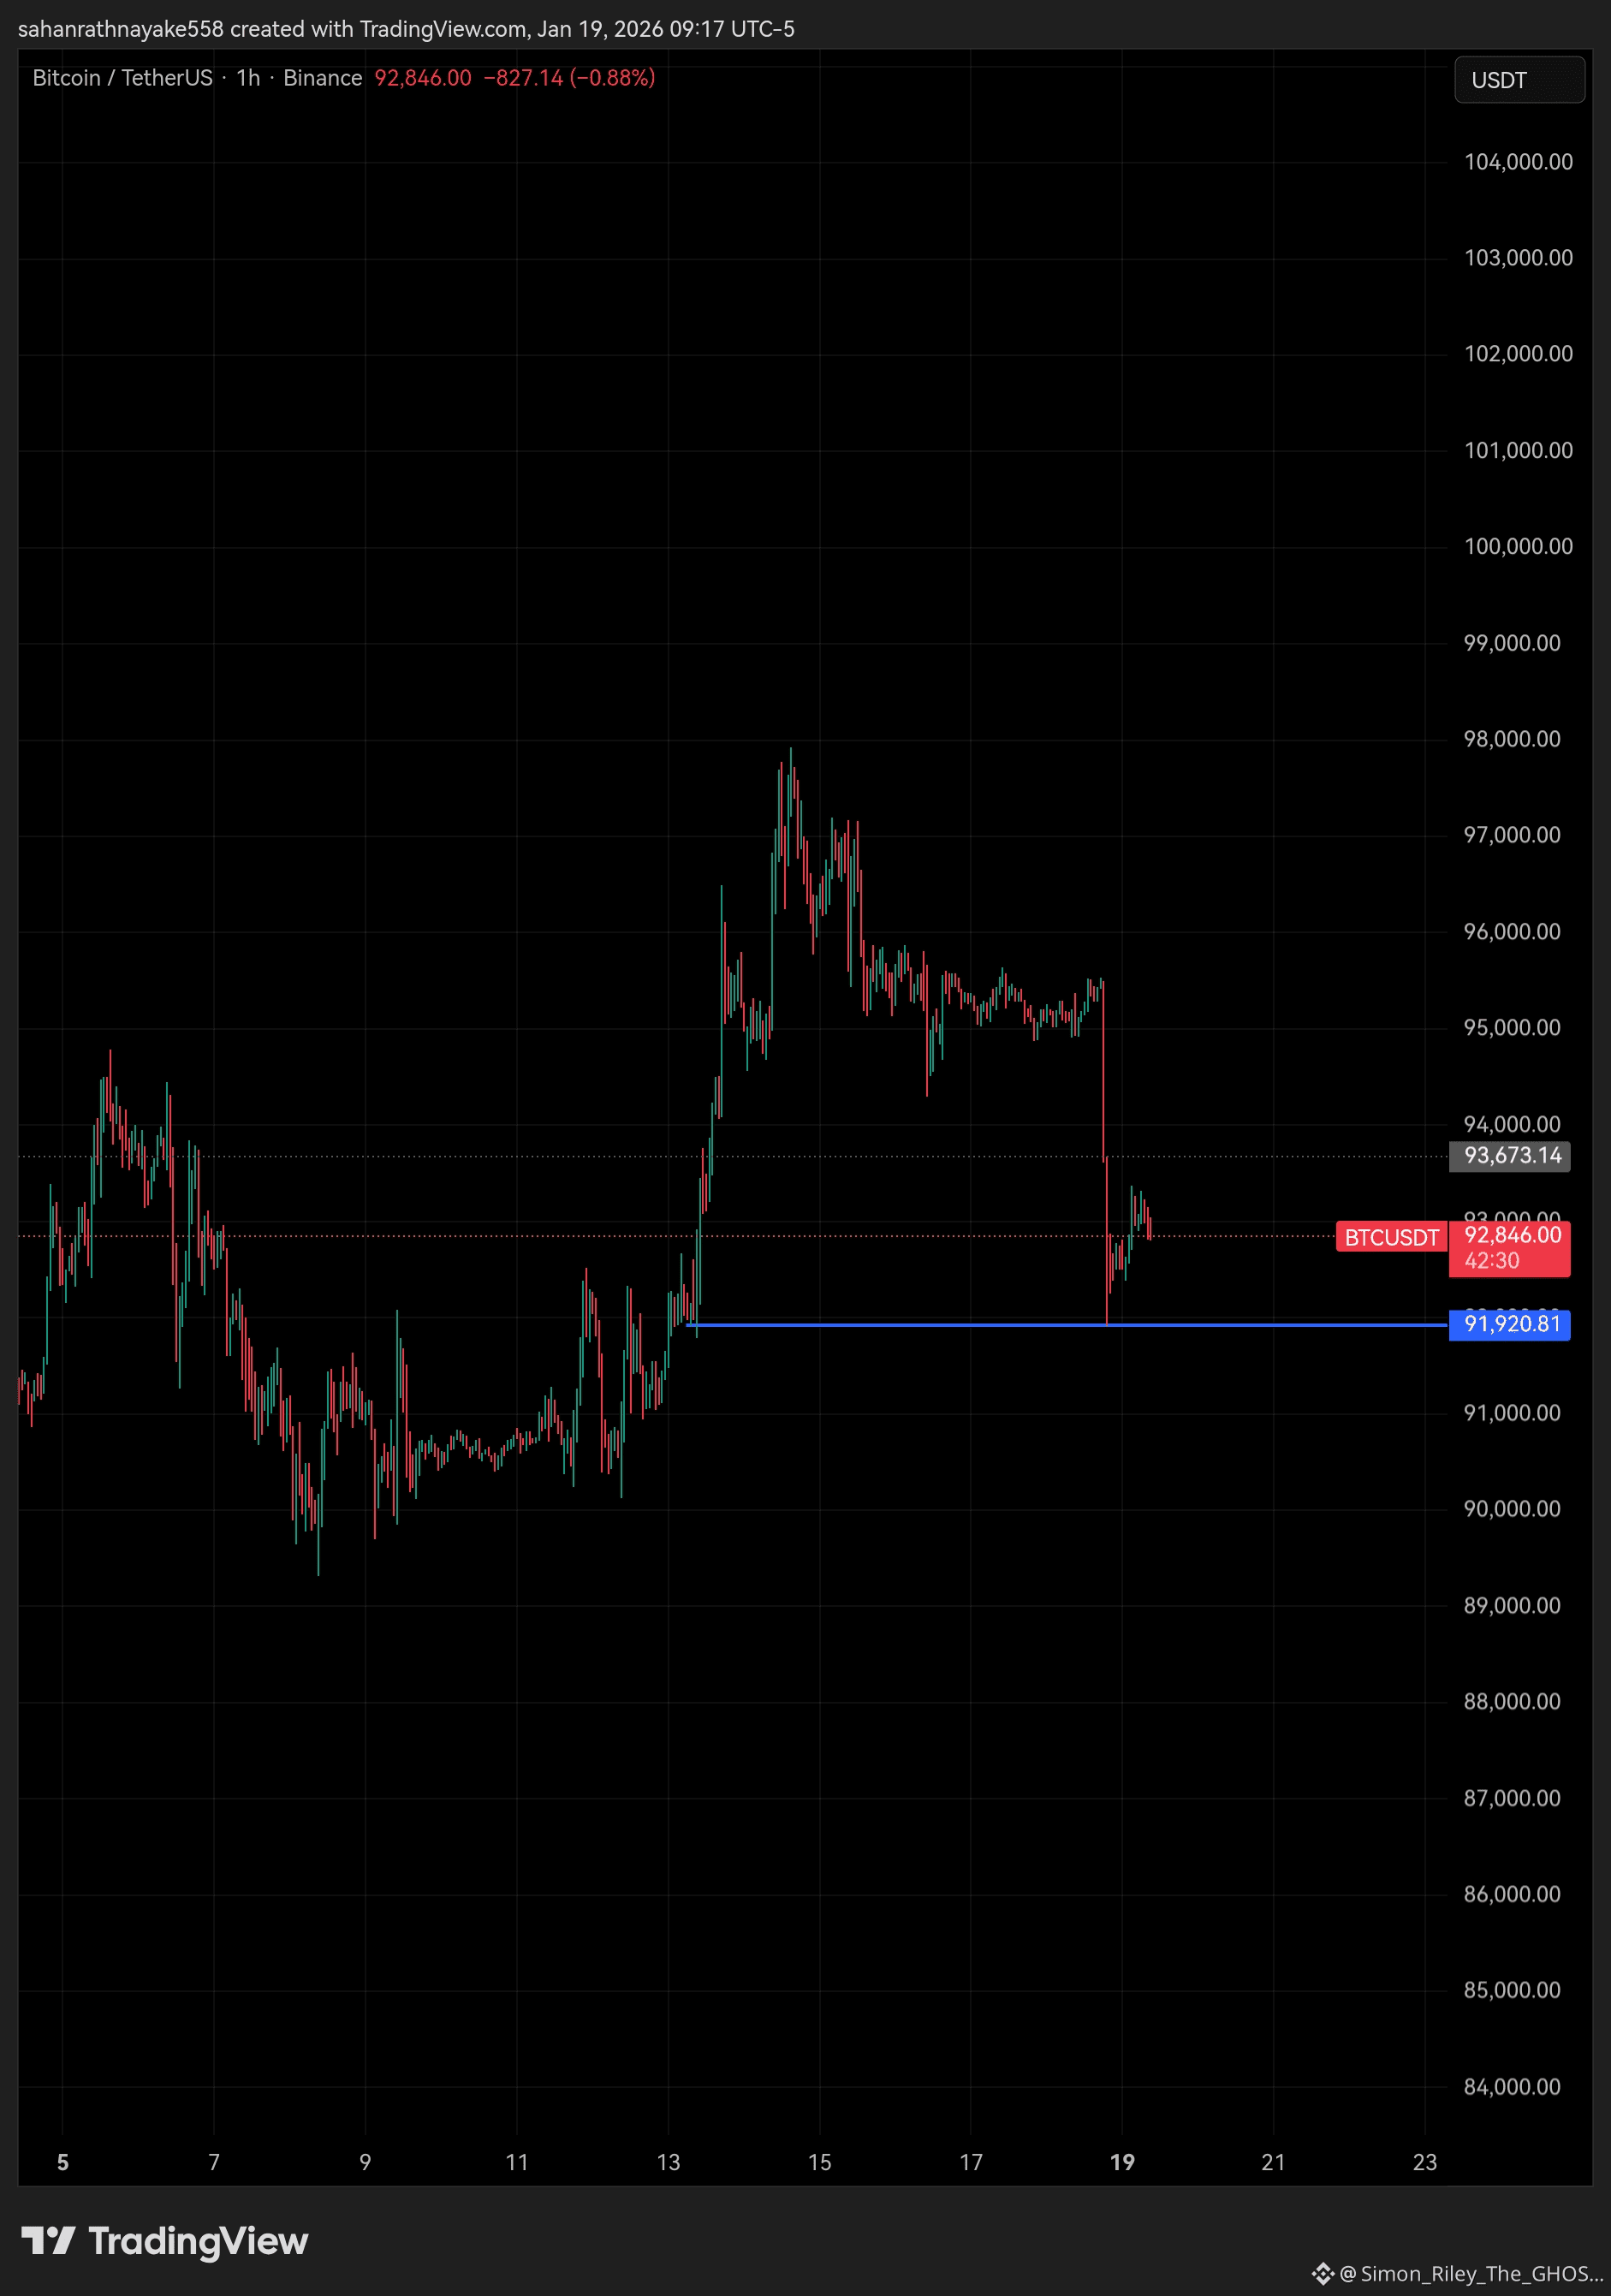
Based on the current BTCUSDT 1 hour chart, Bitcoin is trading around the 92,800 area after a sharp sell off that pushed price into the strong support zone near 91,900. That level has acted as a key demand area in the past and the quick reaction bounce suggests buyers are still defending it. However, the structure remains weak in the short term because price is still below the recent consolidation range around 94,500 to 95,500, which now acts as resistance.
In the near term, Bitcoin is likely to move sideways with increased volatility. If buyers can hold above the 91,900 support and build higher lows, a relief move toward 94,000 to 95,000 is possible. A strong breakout above that zone would signal a recovery continuation and open the door for a retest of the 97,000 to 98,000 area. Until that happens, upside moves may face selling pressure.
On the bearish side, if price fails to hold the 91,900 level and closes below it with volume, the market could see further downside toward the 90,000 psychological level and potentially the 88,500 to 89,000 demand zone. Overall, momentum is currently neutral to slightly bearish, and the next clear direction will likely be decided by how price reacts around the 91,900 support in the next sessions.
Please refer $BTC below image.