📈 ETH holding key support around ~$3,000 with buyers defending lower levels — modest gains seen on price action. On-chain data shows continued accumulation by some holders. �
📉 Market pressure remains after recent drop below $3,000, with funding rates turning negative — a bearish signal. �
📊 Prediction markets show traders think ETH price above $2,800–$2,900 today, but less confidence above higher levels. �
📍 Sentiment leans slightly bearish short-term, but ETH still in play for rebounds if support holds. �
CryptoRank +1
TradingView
Polymarket
Brave New Coin
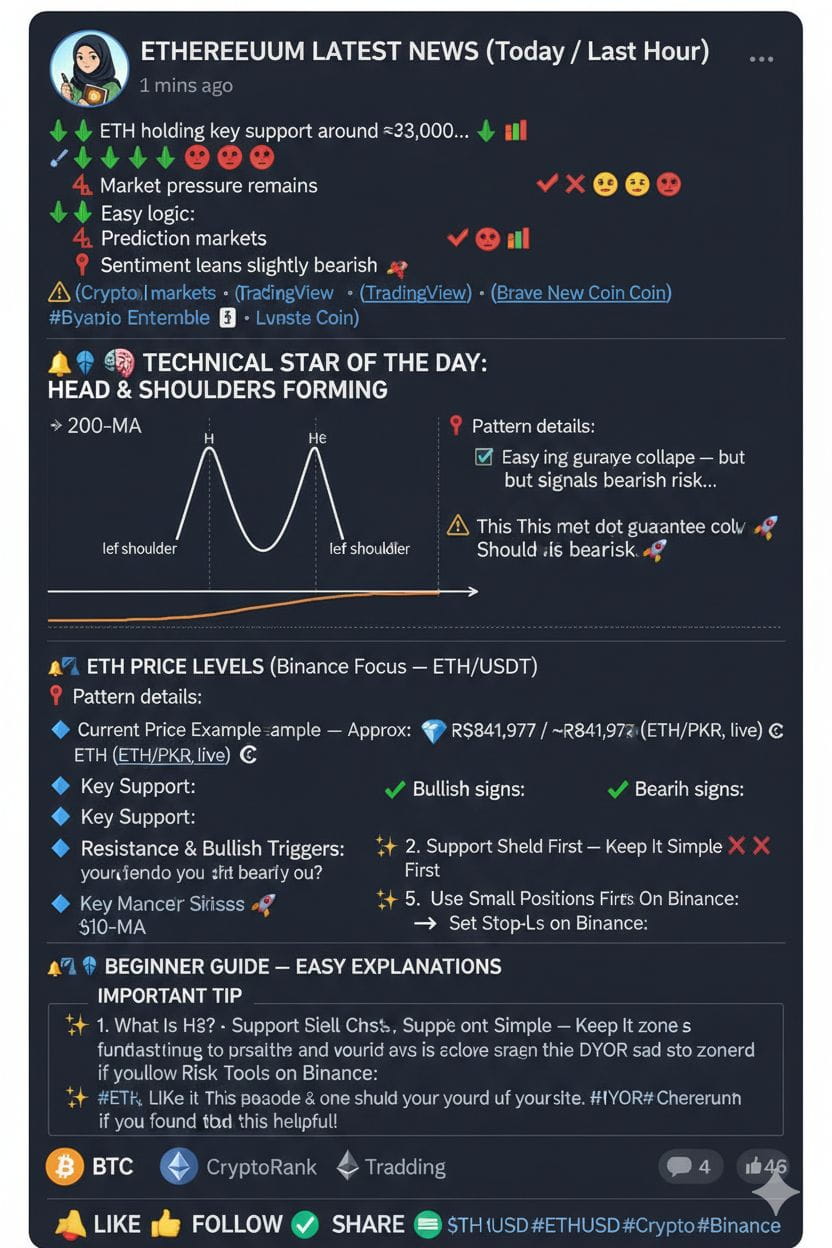
📉 🧠 TECHNICAL STAR OF THE DAY: HEAD & SHOULDERS FORMING
Ethereum’s chart shows a potential Head & Shoulders (H&S) pattern forming — this is a traditional bearish structure in technical analysis:
📌 Pattern details:
➡ The “Right Shoulder” is forming below the daily 200-MA (orange line) — a sign of weakness.
➡ If price breaks below the pattern’s support trendline (Higher Lows) → additional selling pressure could follow.
➡ Typical H&S targets point toward deeper levels — analysts see potential downsides near $1,385 based on the 2.0 Fib extension and key historic zones.
⚠️ This does not guarantee collapse — but it signals bearish risk if breakdown completes.
📌 Easy logic:
✔ Price above support → neutral to recovery bias
❌ Close below support → bearish continuation signal
(You provided this pattern insight, simplified here.)
📊 ETH PRICE LEVELS (Binance Focus — ETH/USDT)
💠 Key Support:
🔹 $2,800 – $2,900 — crucial short-term buyers zone
🔹 $2,700 — deeper risk zone if selling accelerates
💠 Resistance & Bullish Triggers:
🚀 $3,050 – $3,100 — reclaiming here opens room for strength
🚀 $3,200+ — bullish momentum signal
💠 Current Price Example (Approx):
💱 ETH ≈ $3,000 / ~₨841,977 PKR per ETH (ETH/PKR, live) �
CoinMarketCap
📊 📌 SIMPLE CHART CLUES
📈 Bullish signs:
✔ Price keeps above short supports
✔ Bounces off trendline with volume
✔ Reclaims status above 200-MA
📉 Bearish signs:
❌ Break below pattern support
❌ Lower lows forming
❌ Negative funding, weak demand
💡 🤝 BEGINNER GUIDE — EASY EXPLANATIONS
✨ 1. What Is H&S?
Head & Shoulders is a chart shape where price makes 3 peaks — middle highest (head) and two smaller shoulders. It often signals trend weakness if broken down.🔍
✨ 2. Support & Resistance — Keep It Simple
Support is where buyers come in. Resistance is where sellers tighten. If support breaks → price can drop further. If resistance breaks → price could rise.📈
✨ 3. Do NOT Panic Sell
Price patterns show potential, not destiny. Combine pattern signals with real stop-loss and trade plan.🛡️
✨ 4. Use Small Positions First
Avoid putting all funds in one trade. Scale in/out as price confirms direction.📉📈
✨ 5. Follow Risk Tools on Binance:
➡ Set Stop-Loss
➡ Use Take-Profit levels
➡ Check Funding Rates and Open Interest before futures trades
📌 📊 IMPORTANT TIP
📍 ETH is NOT guaranteed to collapse — technical risk exists, but fundamental use (DeFi, smart contracts, staking) remains strong long-term.
📍 Think in zones — not exact numbers.
📍 Always DYOR (Do Your Own Research) before trading.
📢 LIKE 👍 FOLLOW ✅ SHARE 🙌 COMMENT ✍ if you found this helpful!
$ETH #ETH #Ethereum #ETHUSD #ETHUSDT #Crypto #Binance