Let me break this down honestly because both charts are telling very different stories right now.
$FRAX first.
Yes, price moved hard today. Big candle, big percentage but let’s be real for a second. This move looks more like reaction + volatility, not a clean trend continuation yet. After touching the high, price is chopping around the mid-zone. Momentum cooled fast, volume didn’t expand the way I’d want for a sustained run.
For me, Frax right now is more scalp-friendly than swing-friendly. Good for quick moves, but not something I’d chase aggressively at these levels unless it reclaims strength with volume.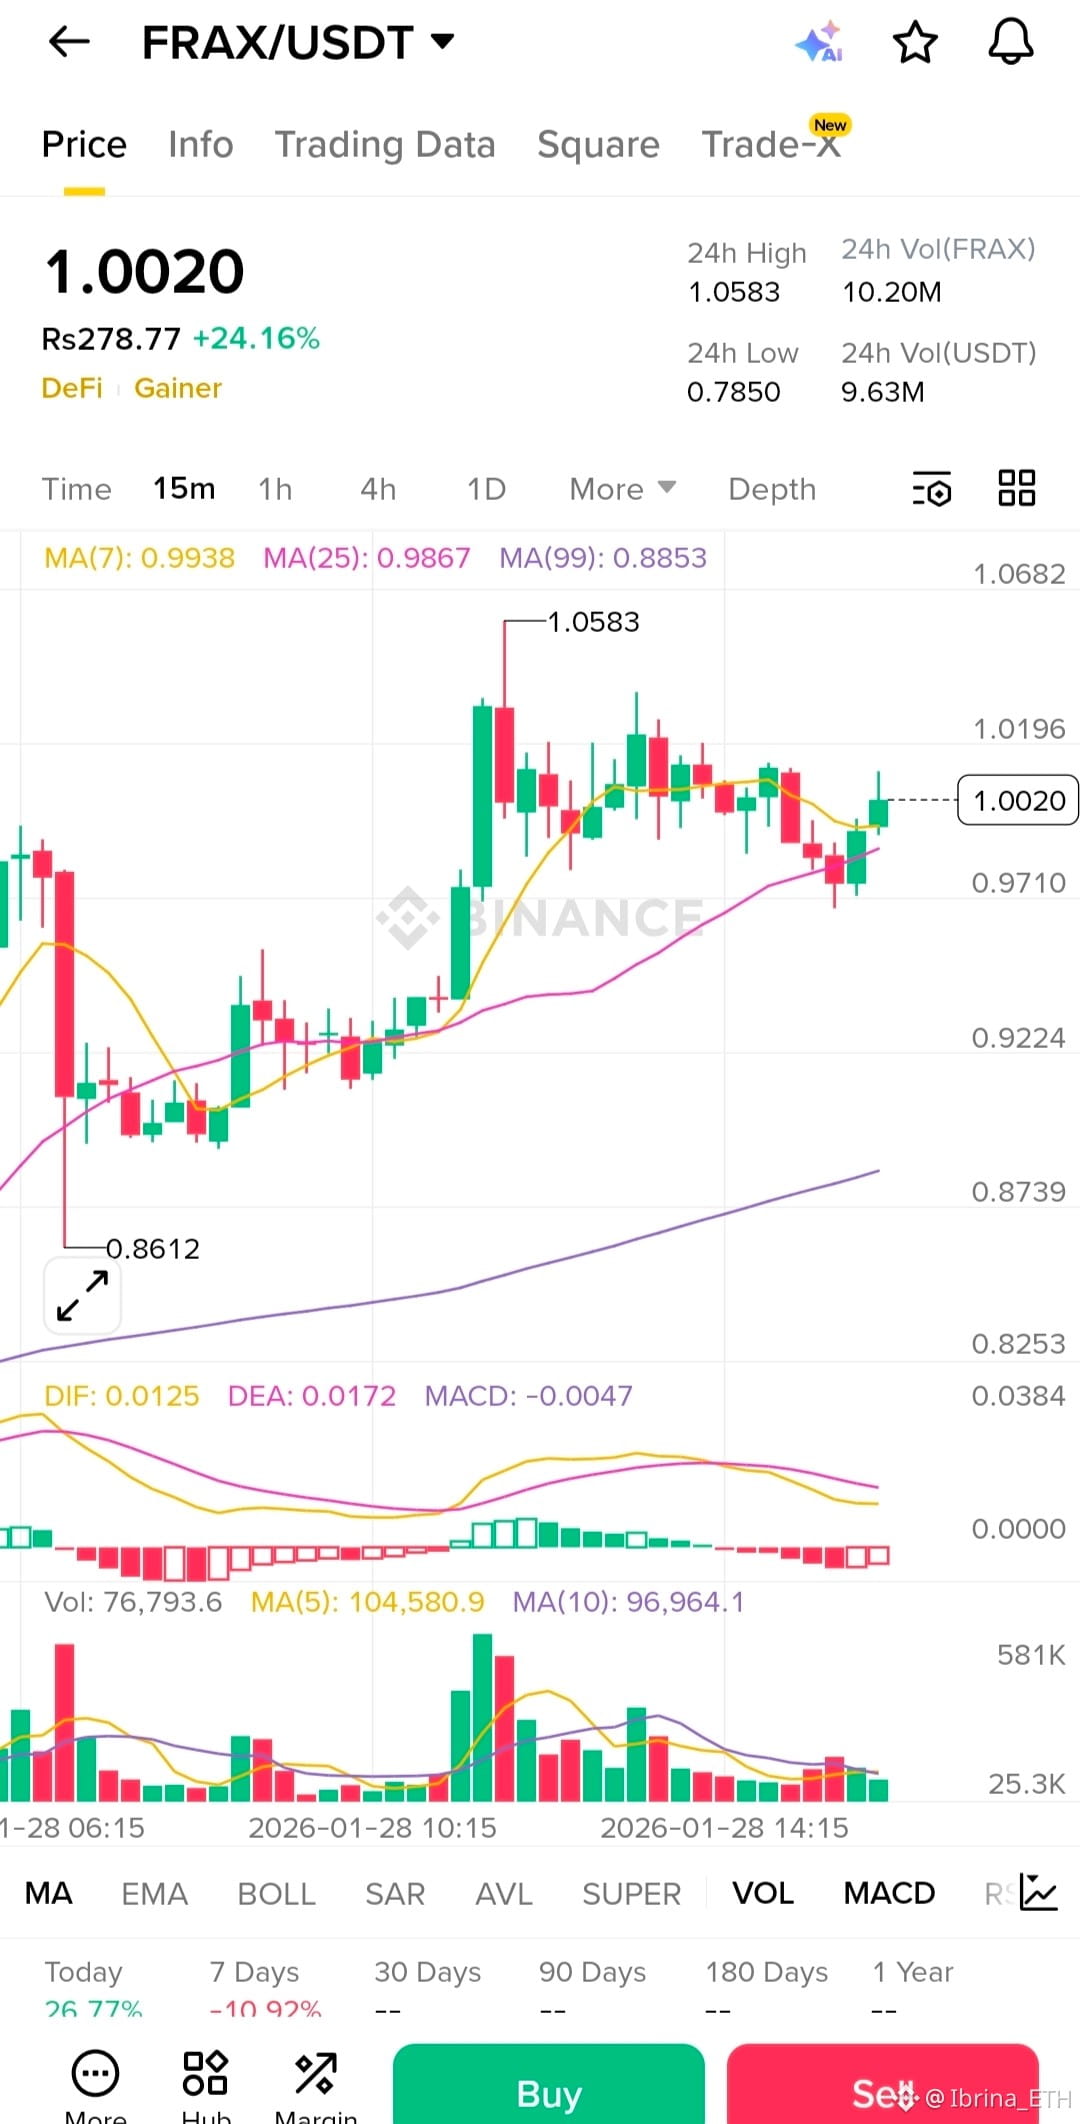
Now $SOMI … different story.
SOMI already did the hard part.
It broke structure, pushed from the 0.25 zone to 0.35, and now it’s doing what strong charts always do pulling back without collapsing.
This is key:
No panic selling
Holding near major support
Pullback happening on declining volume (very healthy)
This tells me sellers are weak, not aggressive.
Right now SOMI is sitting in a decision zone. As long as it holds above the 0.30 area, I see this as accumulation, not distribution.
How I’m viewing it:
FRAx = volatility play, short-term focus
SOMI = structure play, continuation potential
If SOMI reclaims the short-term moving averages and volume steps back in, 0.35 isn’t the top it’s the door.
I’m not here to hype. I’m here to read charts as they are.Smart money doesn’t chase tops it positions during calm pullbacks.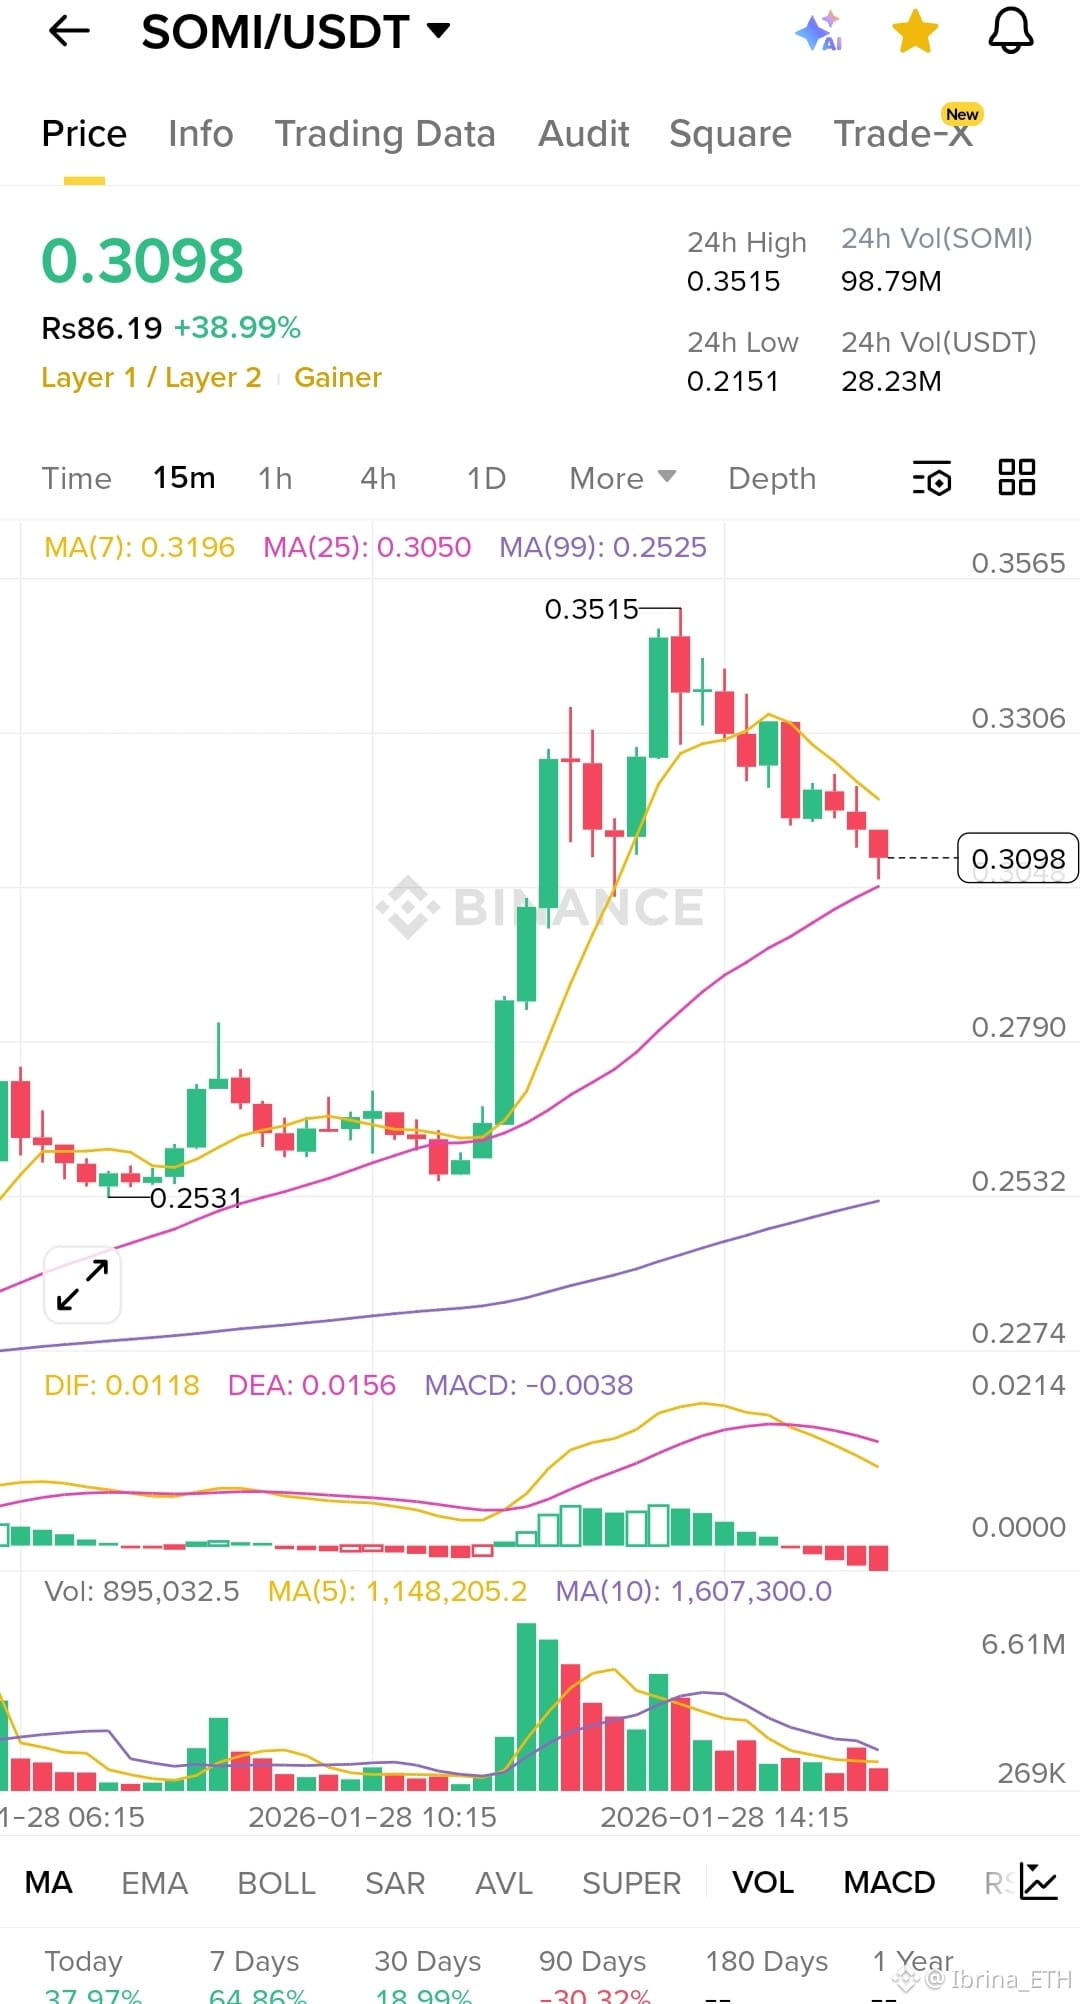
Final thought:
If the market stays stable, I’d rather sit in a chart that already proved strength than chase late momentum.
Now tell me 👇
Are you rotating profits into strength like SOMI, or still hunting volatility moves like FRAx?