Support & Resistance Explained: The Most Important Levels Every Trader Must Know
Ever wondered why prices seem to bounce at certain levels? That's not magic—it's support and resistance at work. These invisible barriers are the foundation of technical analysis, and understanding them can transform your trading game completely.
What Are Support and Resistance?
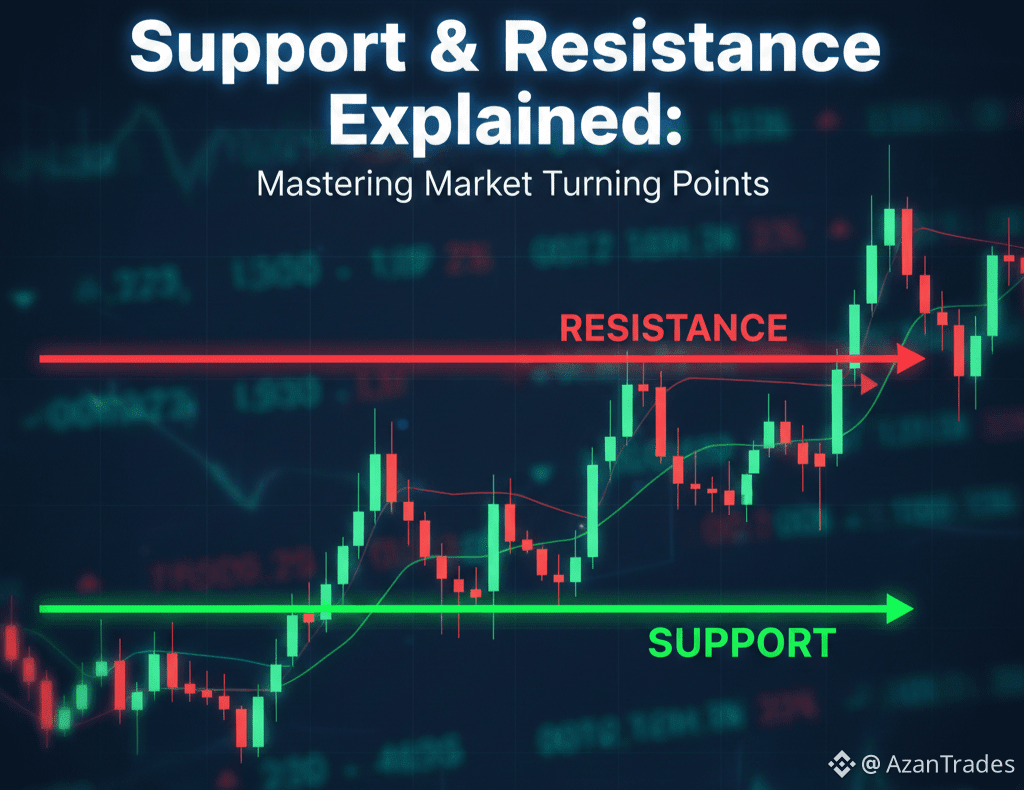
Think of support as a floor and resistance as a ceiling. Support is a price level where buying pressure is strong enough to prevent the price from falling further. It's like a trampoline that catches a falling object and bounces it back up.
Resistance works the opposite way. It's a price level where selling pressure overpowers buying interest, stopping the price from rising higher. Imagine hitting your head on a ceiling—that's resistance stopping upward momentum.
These levels form because of market psychology. When a stock bounces off $50 multiple times, traders remember that level and place their orders accordingly, creating a self-fulfilling prophecy.
Why Do These Levels Matter?
Support and resistance levels help you make smarter decisions about when to enter and exit trades. They show you where other traders are likely to act, giving you an edge in predicting price movements.
At support levels, you might consider buying because prices often bounce upward from there. At resistance levels, you might think about selling or taking profits since prices frequently reverse downward.
These levels also help you set stop-losses and take-profit targets more strategically. Instead of random placement, you're using actual price behavior to guide your risk management.
How to Identify These Levels
Look at your price charts and spot where prices have reversed multiple times. The more times a level has been tested, the stronger it becomes. Three touches or more make it significant.
Horizontal lines aren't the only option. Support and resistance can be diagonal trend lines, moving averages, or even psychological round numbers like $100 or $1,000.
Don't try to pinpoint exact prices. Think in zones rather than precise numbers. A support zone might be $48-$50, not exactly $49.23. Markets are messy, and zones account for that reality.
The Role Reversal Concept
Here's where it gets interesting: broken support becomes new resistance, and broken resistance becomes new support. This flip happens because traders have emotional attachments to these price levels.
If a stock breaks above resistance at $60, that level often becomes support on the next pullback. Traders who missed the breakout wait at $60 to buy, creating buying pressure that supports the price.
Common Mistakes to Avoid
Don't assume every touch of support or resistance will hold. These levels eventually break when market sentiment shifts. The key is watching volume and price action for clues about strength.
Avoid drawing too many lines on your chart. You'll paralyze yourself with analysis. Focus on the most obvious levels where price has clearly reacted multiple times.
Putting It All Together
Support and resistance are your roadmap through market chaos. They won't predict the future perfectly, but they show you where battles between buyers and sellers have happened before.
Start by marking major levels on your charts. Watch how price behaves when it approaches these areas. Does it bounce, break through, or consolidate?
Combine these levels with other analysis tools like volume, candlestick patterns, and indicators. Support and resistance work best when confirmed by additional signals, not in isolation.
The Bottom Line
Mastering support and resistance takes time, but it's worth every minute. These levels are the language the market speaks, and learning to read them separates struggling traders from consistent ones.
Begin with daily or weekly charts to identify major levels. As you get comfortable, add shorter timeframes for precise entry and exit points. Practice on paper before risking real money.
Remember, trading isn't about being right every time. It's about having an edge that works over many trades. Support and resistance give you that edge when used wisely alongside solid risk management.
Stay Tuned. Part 4 dropping Tomorrow
#Tecnicalanalaysis #AzanTrades #Learn