At first glance, this looks like a standard liquidation heatmap.
But zoom out — and the positioning tells a far more uncomfortable story for the market.
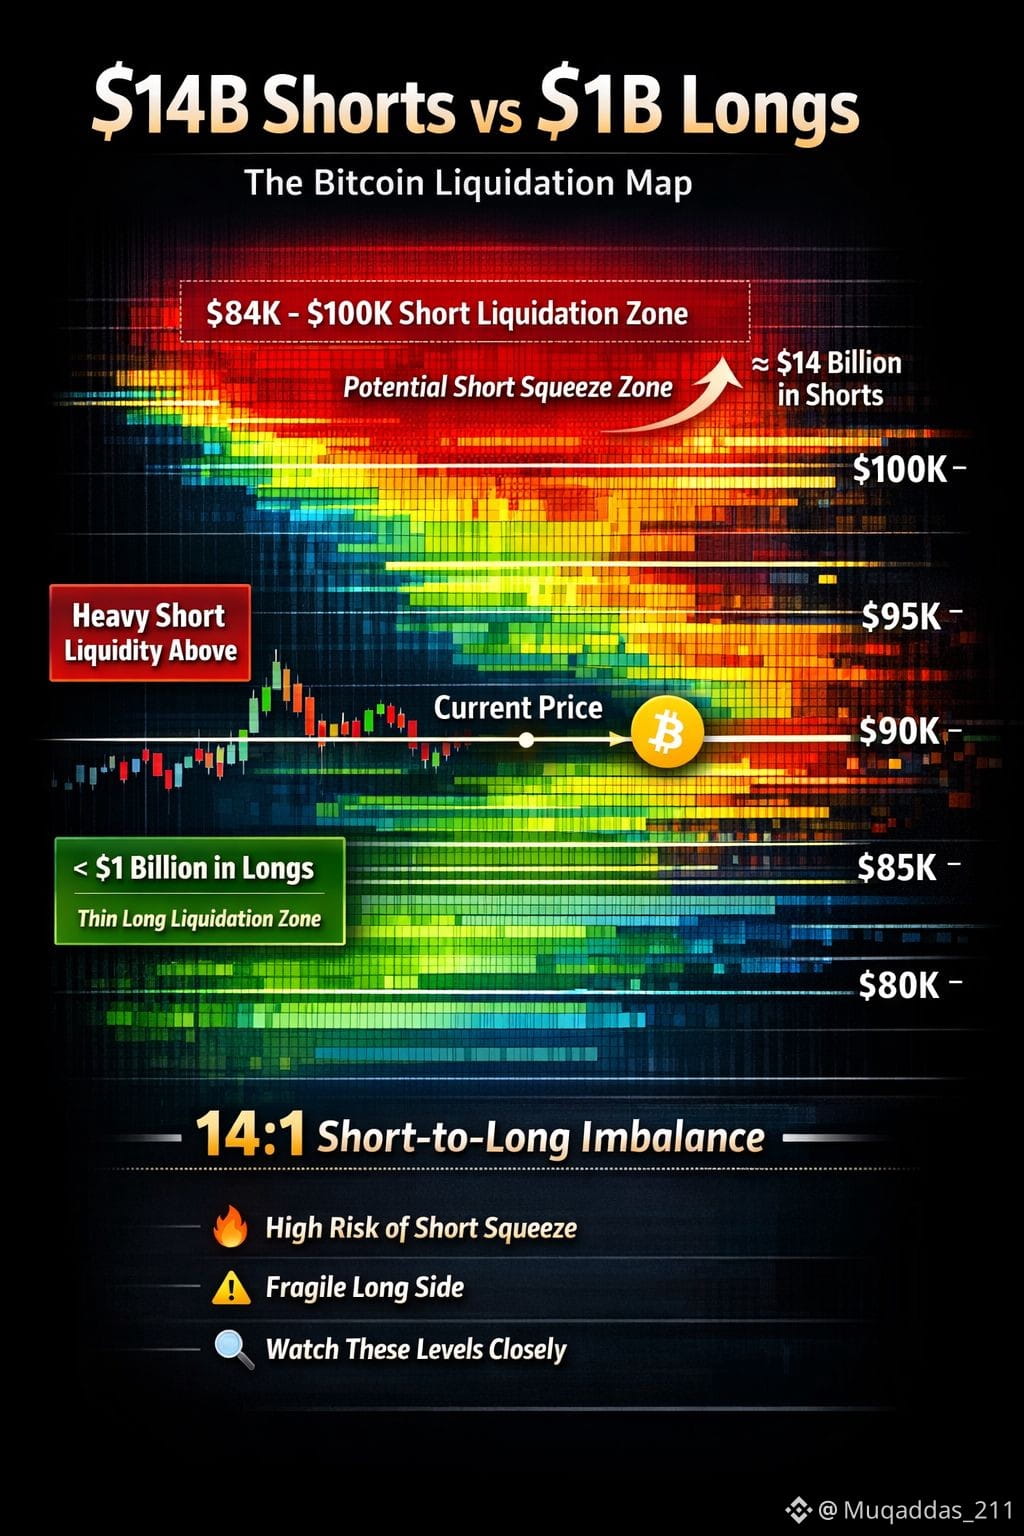
📊 The imbalance is extreme.
• ~$14 BILLION in short leverage stacked above price
• Less than ~$1 BILLION in long liquidations below
That’s roughly a 14:1 short-to-long imbalance.
⚠️ Why This Matters
Liquidation maps aren’t just visuals — they show where forced trades happen.
When shorts get liquidated: ➡️ Exchanges execute market buys
➡️ Market buys push price higher
➡️ Higher price liquidates more shorts
That feedback loop is how short squeezes are born.
🎯 The $90K–$100K Danger Zone
According to Coinglass data, the $84K–$100K range is densely packed with short liquidations.
If $BITCOIN $BTC pushes back toward $90K, it enters a zone where: • Each level breached triggers more forced buying
• Buy pressure compounds rapidly
• Upside can accelerate fast
Meanwhile 👇
The downside is thin. There’s simply not enough long leverage below to create the same cascading effect.
Structurally, risk is asymmetric.
🧠 Reality Check (Important)
This setup does NOT guarantee a squeeze.
📉 We just saw: • 267,000+ traders liquidated in one day
• ~10% drop from the $90K region
Liquidation clusters are magnets, not promises.
Market makers see this data too — and they can push price either direction to access liquidity.
🧩 So What’s the Takeaway?
Bitcoin is currently sitting under one of the most lopsided short-leverage walls of this cycle.
If momentum breaks upward into this zone: 🔥 The fuel for a violent move toward $100K clearly exists.
Whether it ignites depends on: • Liquidity
• Macro conditions
• Sentiment
• Timing
But this is the kind of structural setup experienced traders don’t ignore.
📌 Save the chart.
👀 Watch price around these levels.
🚀 If $BTC moves fast next time — this imbalance may explain why.
Follow Wendy for more market structure insights.
#bitcoin #BTC #Binance #Liquidation #MarketStructure