📉 Why $SOL Price Dropped – Detailed Breakdown
Solana’s recent drop from the $128–132 resistance zone to ~$96 is not random. It’s a mix of technical rejection, market structure shift, and broader sentiment pressure.
Let’s break it down 👇
🔴 1. Major Resistance Rejection ($128–132)
SOL was rejected hard near $128–132, a key supply zone:
Previous distribution area
EMA(99) resistance on higher timeframes
Strong profit-taking zone for swing traders
Once price failed to hold above this level, sellers took control.
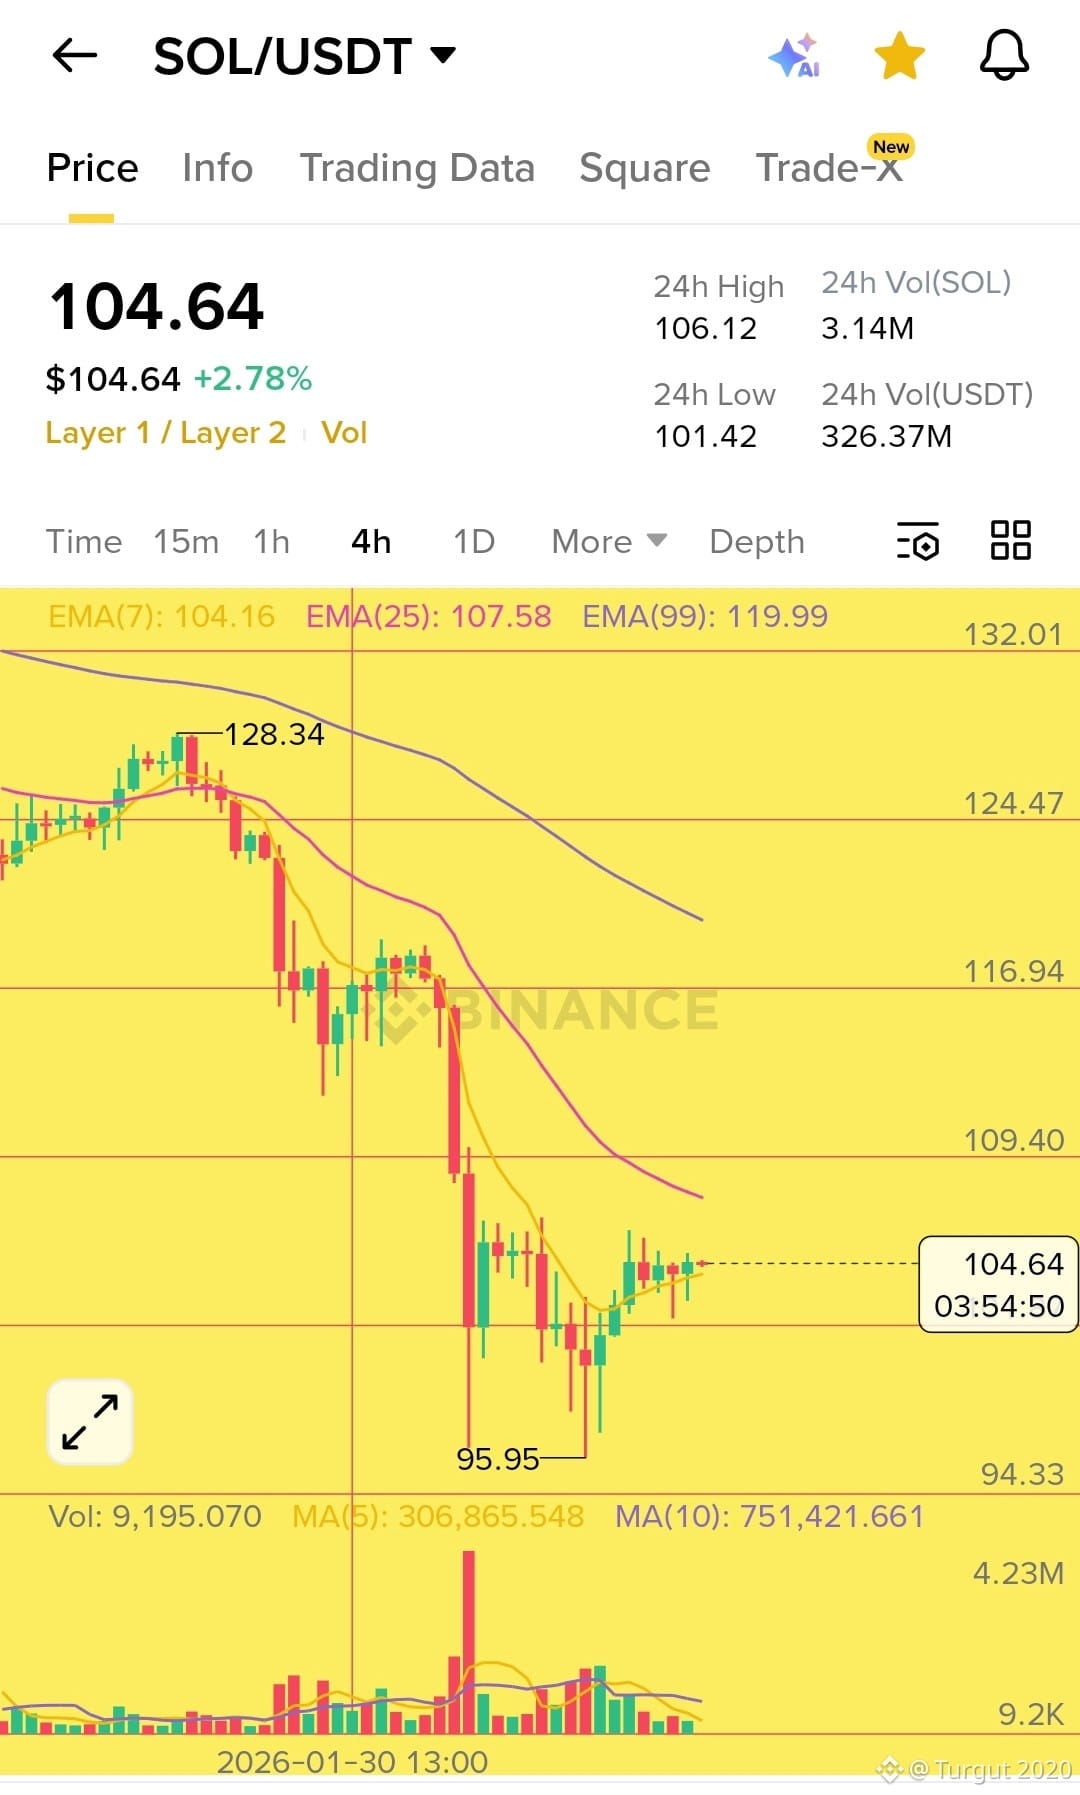
📉 2. Bearish EMA Structure (4H)
On the 4H chart:
EMA(7) < EMA(25) < EMA(99)
Price stayed below EMA(25) during the drop
This confirms:
Short-term momentum turned bearish
Any bounce was corrective, not trend reversal
🧠 3. Liquidity Sweep & Stop Hunt
The sharp move down toward $95.95 looks like:
Long liquidation cascade
Stop-loss hunt below key support
Smart money grabbing liquidity before bounce
This is why we saw a quick rebound, not a slow grind.
📊 4. Volume Spike = Capitulation
Volume increased during the sell-off:
Indicates panic selling + forced liquidations
Often marks local bottoms, not trend bottoms
High red volume followed by stabilization = exhaustion of sellers.
🌍 5. Broader Market Context
SOL didn’t drop alone:
Altcoins weakened overall
BTC dominance pressure
Risk-off sentiment across crypto
When Bitcoin stalls or pulls back, high-beta alts like SOL fall harder.
🔄 Current Situation (Around $104)
Right now SOL is:
Bouncing from liquidity zone
Still below key resistance at $109–116
In a relief rally, not confirmed reversal
📌 Key Levels to Watch
Support: $95 – $100
Resistance: $109 / $116 / $124
Trend flips bullish only if price reclaims EMA(25 & 99) with volume
🧩 Conclusion
The drop was driven by: ✔️ Technical rejection
✔️ EMA bearish structure
✔️ Liquidity sweep & liquidations
✔️ Weak market sentiment
This move looks like a healthy correction after distribution, not the end of Solana — but trend confirmation is still needed before going full bullish.$SOL