Current Price and Recent Movement
• Live Price: ETH is trading around $1,890–$1,920 USD (fluctuating; recent quotes show ~$1,889–$1,917, with some bounces to ~$1,911–$1,919 in the latest ticks).
• 24-Hour Change: Down approximately 8–12% (e.g., -8.16% to -12.50% reported across sources), with high volatility.
• Recent Range: 24h low near $1,748–$1,755, high near $2,142–$2,143. It has seen a sharp drop from levels above $2,700 earlier in the week.
• Broader Performance: Down ~32–35% over the past week, ~40–42% over the past month, reflecting a strong bearish trend.
Key Technical Indicators (Daily Timeframe Summary)
Most aggregated signals point to Strong Sell or heavy bearish bias:
• Moving Averages: Strong Sell overall. Price is well below key EMAs/SMAs (e.g., below 5-day, 20-day, 50-day, 100-day, and 200-day levels, which act as overhead resistance). Only 1–3 buy signals vs. 9–12 sell signals.
• Oscillators/Momentum:
• RSI (14): Around 21–32 (deeply oversold in many readings, e.g., 21.23 on TipRanks). This suggests potential exhaustion of sellers and a possible short-term bounce, but in a downtrend, oversold can persist.
• MACD: Negative (e.g., -152.81), confirming bearish momentum.
• Overall Summary (from TradingView/Investing.com): Strong Sell on daily, with 1-week trend “strong sell” and 1-month “sell”. Some short-term rebounds are possible due to oversold conditions.
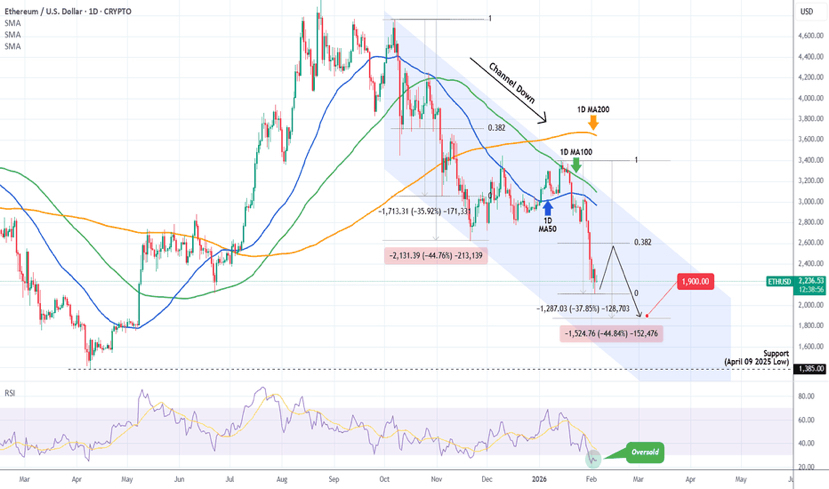
Chart Patterns and Levels
• ETH has broken down from prior structures (e.g., falling wedge or channels mentioned in recent analyses), accelerating the decline.
• Support Levels:
• Immediate: ~$1,800–$1,825 (potential target from Elliott Wave/Z-wave analyses).
• Deeper: $1,700–$1,800 psychological/prior lows; further to $1,450 in extended bear cases.
• Resistance Levels:
• Near-term: $2,000–$2,100 (recent “rebound zone” and psychological).
• Higher: $2,200–$2,300 (prior support turned resistance); $2,800+ for any meaningful recovery.
• The price is hugging lower ranges after forced liquidations, with funding rates turning negative (bearish perpetuals signal).
Broader Context
The market shows extreme fear, with heavy outflows (e.g., negative CMF/DMI/ADX confirming trend strength downward). This aligns with correlated BTC weakness. While oversold RSI hints at a possible relief bounce (potentially to $2,100–$2,300 “rebound zone”), the dominant trend remains bearish unless key supports hold and momentum reverses. Analysts note this as “forced liquidations” rather than fundamental shifts, but recovery to higher levels like $3,000 seems off the table short-term in February 2026.
Disclaimer: Crypto markets are highly volatile; this is not financial advice. Always use stop-losses, and consider multiple timeframes/sources for confirmation. For real-time charts, check TradingView (ETHUSD) or similar platforms.#MarketCorrection #WhaleDeRiskETH