BNB is currently attempting to stabilize after a significant pullback from its recent highs. Here is a quick technical look at the 4H chart:
🔍 Key Highlights:
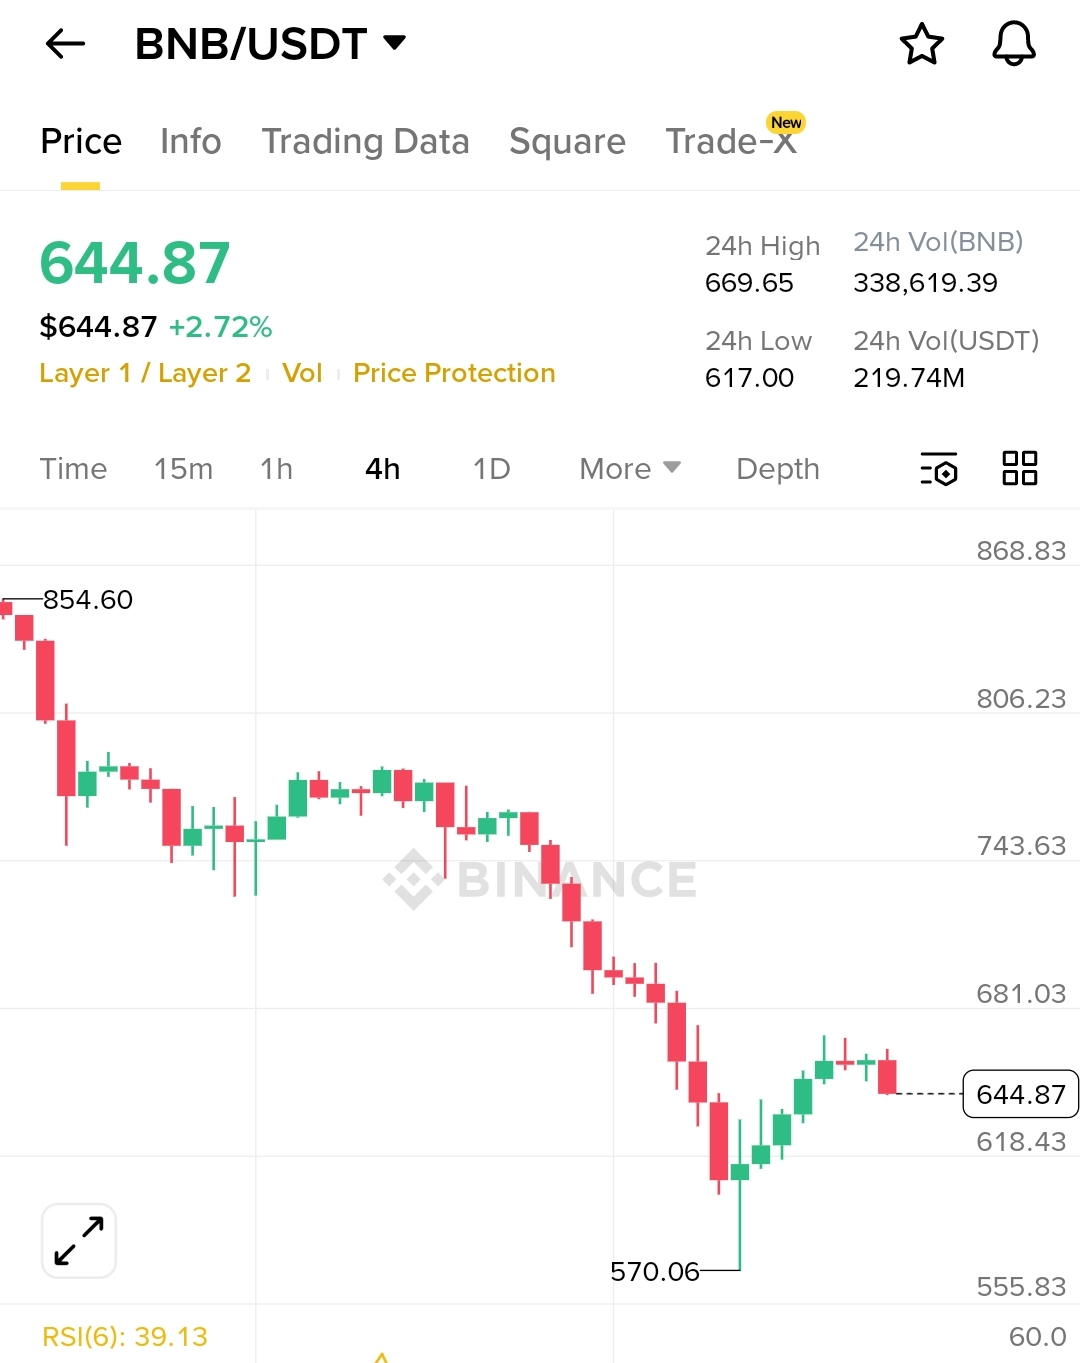
Price Action: After dropping to a recent low of $570.06, BNB has recovered slightly and is currently trading around $644.87, up +2.72% in the last 24 hours.
Trend Status: The chart shows a series of lower highs and lower lows, indicating a bearish trend over the past few days. However, the current green candles suggest a potential reversal or relief rally starting from the $570 support zone.
RSI Check: The RSI(6) is at 39.13, which is nearing the oversold territory. This suggests that the downward momentum might be slowing down, giving bulls a chance to step in.
Key Levels to Watch:
Resistance: The immediate hurdle is around $681.00. A breakout above this could lead to a test of the $743 level.
Support: Strong support is established at $570.06. If this level fails, we might see further downside.
💡 Strategy:
BNB remains one of the strongest Layer 1 assets. Traders should look for a confirmed breakout above the recent resistance with high volume before entering long positions.
Trade safe and always use a Stop-Loss! 🛡️
#BNB #BinanceSquare #CryptoAnalysis #TechnicalAnalysis #Layer1