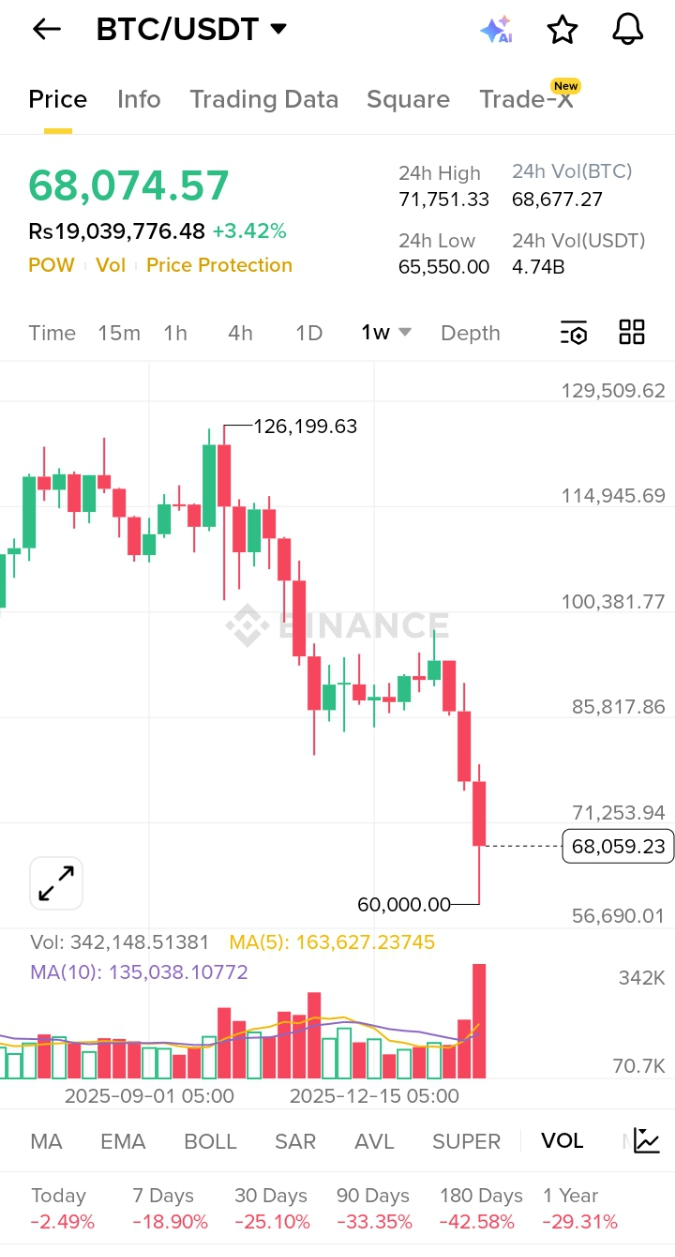
$BTC/USDT current Price: 68,074 USDT
Weekly Trend: Strong bearish
Support / Resistance: Key levels identified below
Timeframe Analyzed: 1W chart with daily implications
1️⃣ Market Context
Trend: Downtrend since ~126k → 60k
Recent Action: Sharp drop, last weekly candle wicks to 60k, weak bounce to ~68k
Volume: High sell volume, weak buying on recovery
Technical Signals:
MA(5) & MA(10) above price → bearish bias
Lower highs & lower lows → trend continuation
Conclusion: Market favors sellers, but a short-term bounce is possible.
2️⃣ Key Levels
Type
Level (USDT)
Notes
Major Support
60,000
Strong bounce last week, must hold for relief rally
Minor Support
65,500
Immediate floor, currently fragile
Immediate Resistance
71,200 – 72,000
First weekly resistance
Medium Resistance
75,000 – 78,000
Supply zone if short-term rally occurs
Trend-Changing Resistance
85,000
Bullish confirmation, unlikely next week
3️⃣ Daily Forecast (Feb 7 – Feb 13, 2026)
Feb 7 (Today / Sunday)
Likely action: Sideways recovery / small green candle
Key level: 65,500 support
Expectation: Weak buying, may retest 68,500 – 69,000
Strategy: Observe volume. Avoid heavy long positions.
Feb 8 (Monday)
Likely action: Testing resistance zone 71,200 – 72,000
Scenario A: Rejection → drop back to 66k (bearish)
Scenario B: Break above 72k → relief rally to 75k (less probable)
Key levels: 71.2k resistance, 65.5k support
Feb 9 (Tuesday)
Likely action: Consolidation or minor pullback
Price may hover: 66k – 70k
Watch for weekly trend confirmation: if it dips below 65k, risk increases
Feb 10 (Wednesday)
Likely action: Bearish pressure
Possible retest: 65k support
Key indicators: Look for spike in sell volume
Probability of drop: ~40–50%
Feb 11 (Thursday)
Likely action: Bounce or dead-cat recovery
Price may rise to: 68k – 70k
Volume confirmation is critical for judging if rally has legs
Feb 12 (Friday)
Likely action: Range-bound
Expected range: 65k – 70k
Scenario: Weak buyers struggle to hold above 68k, risk of another drop
Feb 13 (Saturday)
Likely action: Critical weekly close approach
Key level: Weekly close above 72k needed to change short-term bearish bias
Else: Continuation of downtrend to 60k or lower next week
4️⃣ Trading Strategy / Action Plan
Spot Traders
Buy aggressively near 60k–65k only
Take profits near 71–72k, do not chase further upside
Avoid adding positions above 72k without weekly confirmation
Futures / Leverage
Short opportunities: 70k – 72k
Stop loss: Just above 72k
Target: 65k → 60k, depending on weekly momentum
Avoid high leverage during bounces
Risk Management
Weekly support (60k) is critical
Do not hold long positions if price closes below 60k on weekly candle
Keep stop-loss tight in volatile conditions
5️⃣ Summary Table (Quick Reference)
Day
Expected Action
Support
Resistance
Notes
Feb 7
Sideways recovery
65.5k
68.5k
Weak bounce
Feb 8
Test resistance
65.5k
71.2k
Likely rejection
Feb 9
Consolidation
65k
70k
Watch volume
Feb 10
Bearish pressure
65k
68k
Possible drop
Feb 11
Dead-cat bounce
65.5k
70k
Weak upside
Feb 12
Range-bound
65k
70k
Choppy market
Feb 13
Critical weekly close
60k
72k
Decide trend direction
✅ Key Takeaways
Market remains bearish until weekly close above 72k
60k is a major support; a break will trigger deeper drop
Expect volatility, choppy sideways action, and potential dead-cat bounces
Stick to risk management: small positions near support, take profit at resistance
