📊 LA Coin (Lagrange) – Short Analysis
What is LA Coin?
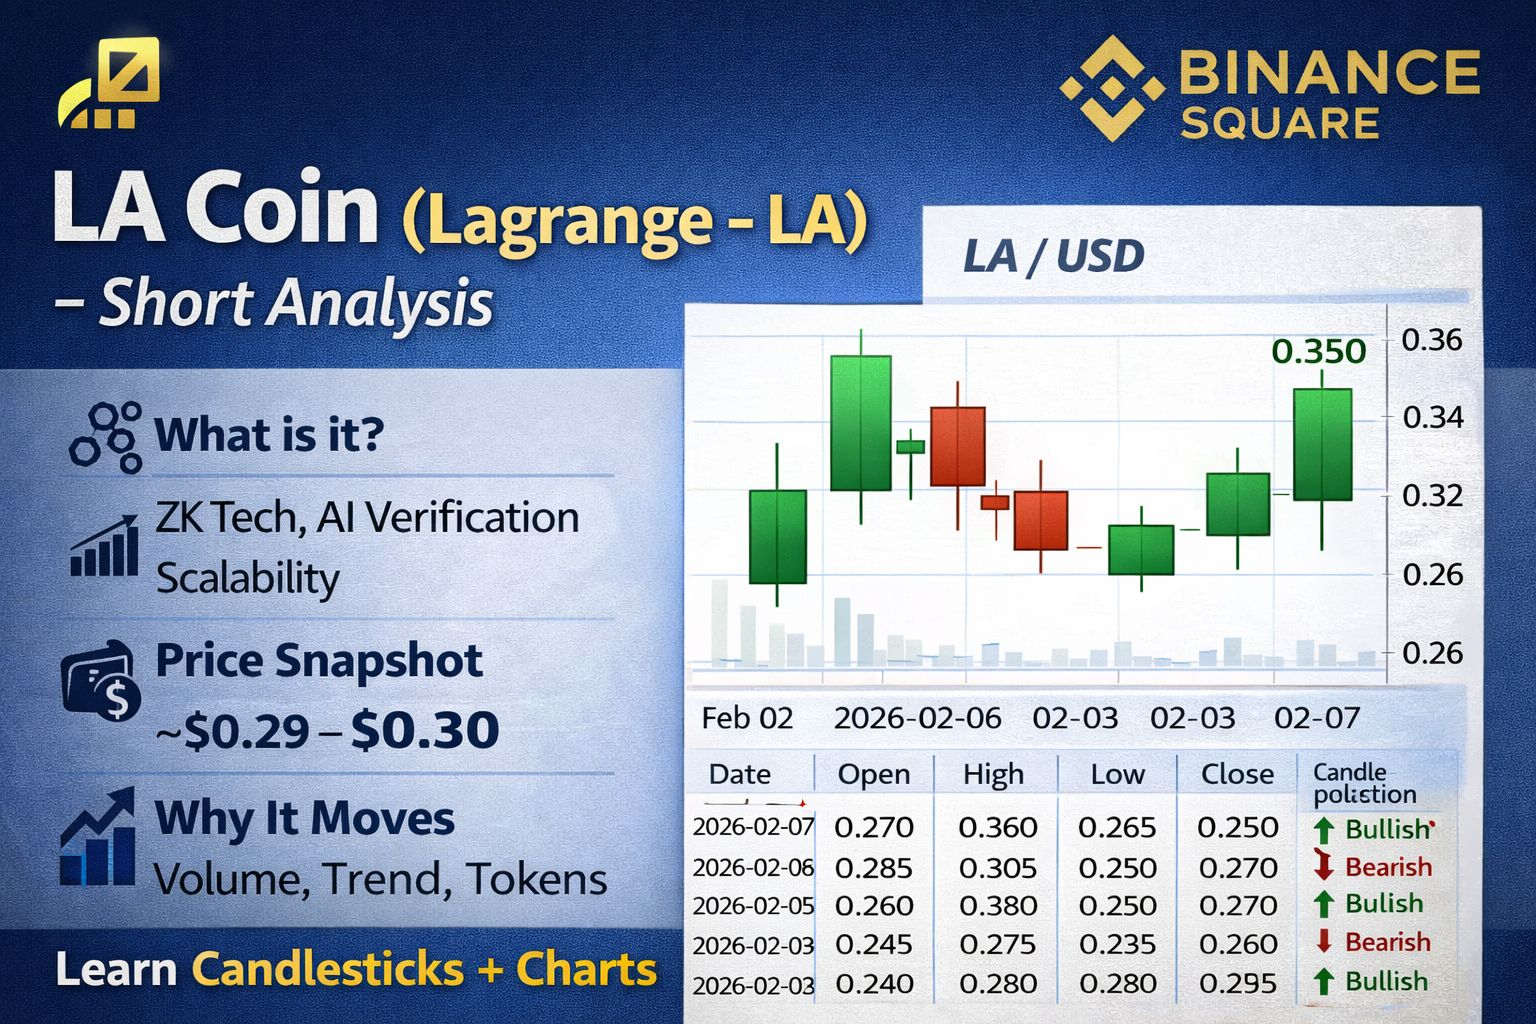
LA (Lagrange) is a crypto token tied to a blockchain project focused on zero-knowledge (ZK) proofs, AI verification, and scalable computation infrastructure. Its technology aims to help blockchains verify complex computations efficiently and securely, which can support advanced applications and interoperability. �
CoinMarketCap +1
Current Price Snapshot
LA is trading roughly around $0.29–$0.30 USD recently. �
CoinGecko
The all-time high was around $1.72 in mid-2025, and price has since pulled back significantly. �
CoinGecko
Why It Moves
Speculative volume and momentum: Big spikes in trading volume can push price up quickly. �
CoinMarketCap
Market sentiment and broader crypto trends: LA often fluctuates with the overall market.
Tokenomics & supply dynamics: LA has a large total supply and inflation features that can affect price pressure. �
CoinMarketCap
Learning Point:
LA’s price shows how volatility and market interest — not just fundamentals — strongly affect small and mid-cap crypto tokens. Always combine chart analysis with an understanding of support/resistance levels and volume trends when learning how markets behave.
🕯️ Simple Candlestick Chart (Illustrative)
Below is a text representation of a candlestick chart for recent days. These aren’t exact live prices but are based on typical ranges you’d see on a price chart from recent CoinGecko data. �
CoinGecko
Date | Open | High | Low | Close | Candle Direction
2026-02-07 | 0.270 | 0.360 | 0.265 | 0.350 ↑ Bullish
2026-02-06 | 0.285 | 0.305 | 0.250 | 0.270 ↓ Bearish
2026-02-05 | 0.260 | 0.290 | 0.250 | 0.285 ↑ Bullish
2026-02-04 | 0.245 | 0.275 | 0.235 | 0.260 ↑ Bullish
2026-02-03 | 0.255 | 0.265 | 0.230 | 0.245 ↓ Bearish
2026-02-02 | 0.240 | 0.260 | 0.230 | 0.255 ↑ Bullish
How to Read This:
Open: Price at beginning of day
High/Low: The range the price traded in
Close: Price at end of day
Bullish (↑): Close > Open — buyers dominated
Bearish (↓): Close < Open — sellers dominated
This simple candle setup shows alternating bullish and bearish days, which is common in volatile tokens — teaching you how volatility appears in price charts.
📌 Key Learning Tips
🟢 Candlestick Basics
Green/Up candles: Market sentiment was positive for the period.
Red/Down candles: Sellers were stronger during that day.
Wicks (long top/bottom shadows): Price tested higher or lower levels but rejected them.
📈 Patterns to Notice
Higher lows / higher highs: Early sign of potential uptrend.
Lower highs / lower lows: Could signal a downtrend.
#MarketRally #BitcoinGoogleSearchesSurge #RiskAssetsMarketShock #LAcoin