📊 PYR Coin (Vulcan Forged) — Short Analysis
What is PYR?
PYR is the native utility token of Vulcan Forged, a blockchain gaming ecosystem and NFT marketplace with games like VulcanVerse, Berserk, and other play-to-earn mechanics. PYR is used for staking, fees, upgrades, rewards, and gaming incentives within the ecosystem. �
CoinMarketCap +1
Current Price & Market Data
PYR is trading around ~$0.31–$0.36 USD (recent data) with active trading volume. �
CoinGecko
It has a max supply of 50 million tokens with most in circulation. �
CoinMarketCap
PYR’s all-time high was ~$49.7, and current levels are far below that peak. �
CoinGecko
Why It Moves
Gaming & NFT demand: Token utility in game progression, staking, and marketplace fees influences trading interest. �
KuCoin
Market sentiment: Broad crypto market trends and gaming sector interest affect volatility.
Volume spikes: Big moves often happen during volume surges as traders react to price levels.
Learning Insight:
Smaller tokens like PYR tend to show wide price swings — meaning both big gains and big dips — because of fluctuating trader interest and lower liquidity compared with major tokens.
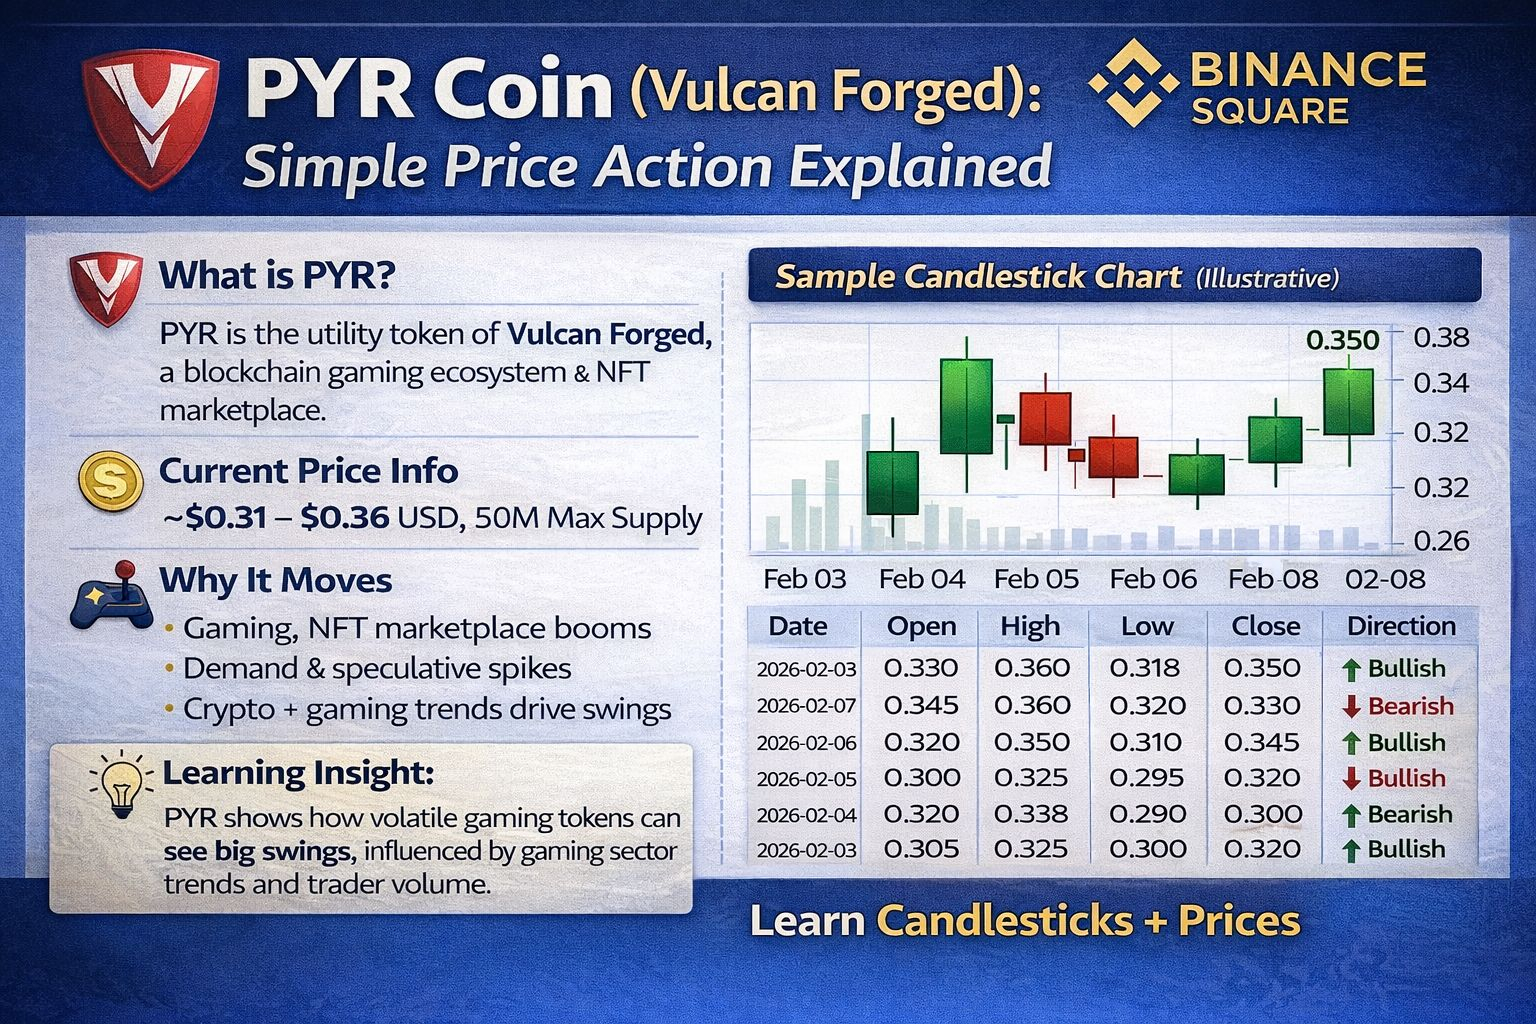
🕯️ Sample Candlestick Chart (Text Format)
This is a simplified, illustrative daily candle table showing how a candlestick chart might look for a recent week of PYR trading. (Not exact prices but consistent with recent trading ranges from live data.) �
CoinGecko
Date | Open | High | Low | Close | Direction
2026-02-08 | 0.330 | 0.360 | 0.318 | 0.350 ↑ Bullish
2026-02-07 | 0.345 | 0.360 | 0.320 | 0.330 ↓ Bearish
2026-02-06 | 0.320 | 0.350 | 0.310 | 0.345 ↑ Bullish
2026-02-05 | 0.300 | 0.325 | 0.295 | 0.320 ↑ Bullish
2026-02-04 | 0.320 | 0.338 | 0.290 | 0.300 ↓ Bearish
2026-02-03 | 0.305 | 0.325 | 0.300 | 0.320 ↑ Bullish
📖 How to Read This:
Open: Start of day price
Close: End of day price
High / Low: Price range during the day
Bullish (↑): Close higher than open — buyers stronger
Bearish (↓): Close lower than open — sellers stronger
📌 Learning Takeaways
🟩 Candlestick Basics
Green/Bullish candle: Shows buyers pushed price up.
Red/Bearish candle: Shows sellers drove price down.
Wicks: The lines above/below the body show testing of higher or lower prices that didn’t hold.
Understanding these can help you see market sentiment — whether buyers or sellers are dominant during a period, and potential support/resistance areas in price charts.
#RiskAssetsMarketShock #WhenWillBTCRebound #JPMorganSaysBTCOverGold #WarshFedPolicyOutlook