1️⃣ Market Structure Basics
Market structure is built from swing highs and swing lows:
HH (Higher High) → bullish strength
HL (Higher Low) → bullish continuation
LH (Lower High) → bearish weakness
LL (Lower Low) → bearish continuation
An uptrend = HH + HL
A downtrend = LH + LL
2️⃣ Demand Zones (Green Areas)
Green boxes represent demand zones:
Areas where buyers previously stepped in strongly
Price often reacts or bounces from these zones
In an uptrend, demand zones form at higher lows
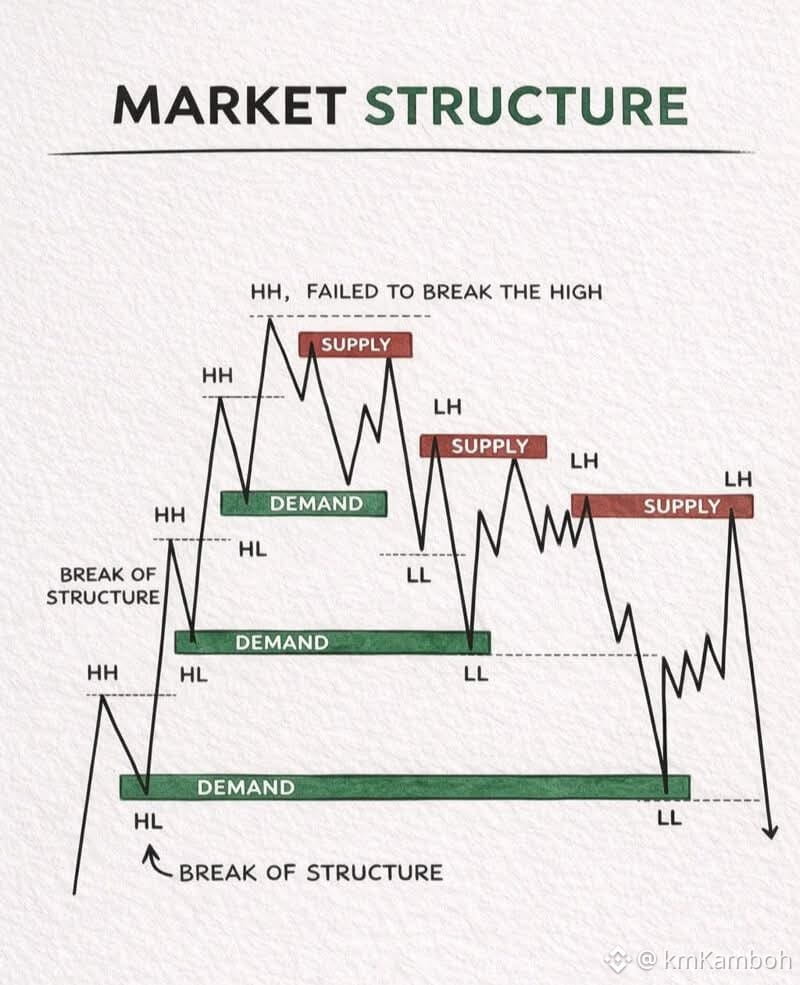
In the image:
Price keeps respecting demand during the bullish phase
Each pullback into demand creates a new HH
3️⃣ Supply Zones (Red Areas)
Red boxes represent supply zones:
Areas where sellers dominated
Price struggles or reverses from these zones
In a weakening market, supply forms at lower highs
In the image:
Price fails to break the high at supply
This failure is an early sign of trend exhaustion
4️⃣ Break of Structure (BOS)
A Break of Structure happens when:
In an uptrend → a Higher Low is broken
In a downtrend → a Lower High is broken
In the image:
Price breaks below a previous HL
This confirms a shift from bullish to bearish
Demand fails → structure flips
This is one of the most important confirmation signals in price action trading.
5️⃣ Trend Shift Confirmation
After BOS:
Price forms a Lower Low (LL)
Pullbacks create Lower Highs (LH)
Supply zones now hold instead of demand
This confirms:
Bullish → Bearish market structure change
6️⃣ Trading Insight from This Structure
❌ Buying at old demand after BOS is risky
✅ Best sells come from LH + Supply zones
✅ Trend continuation trades align with LL formation
⚠️ warning = failure to break HH at supply
📌 Key Takeaway
This image teaches how trends start, weaken, and reverse using:
Market structure
Supply & demand
Break of structure confirmation
Mastering this concept helps you: ✔ Avoid fake breakouts
✔ Trade with trend bias
✔ Enter at high-probability zones