Bitcoin is currently trading around the $78K zone after experiencing a strong rally followed by a noticeable pullback. The weekly chart shows that BTC is now testing an important previous support-turned-demand area, making this a critical decision point for the market.
📊 Market Structure Overview
Over the past year, Bitcoin moved through three major phases:
Strong Uptrend – Price surged aggressively, forming higher highs and higher lows.
Distribution Phase Near the Top – Volatility increased as BTC struggled to maintain momentum above the $100K+ region.
Corrective Pullback – Price retraced sharply and is now sitting near a key support zone around $74K–$75K.
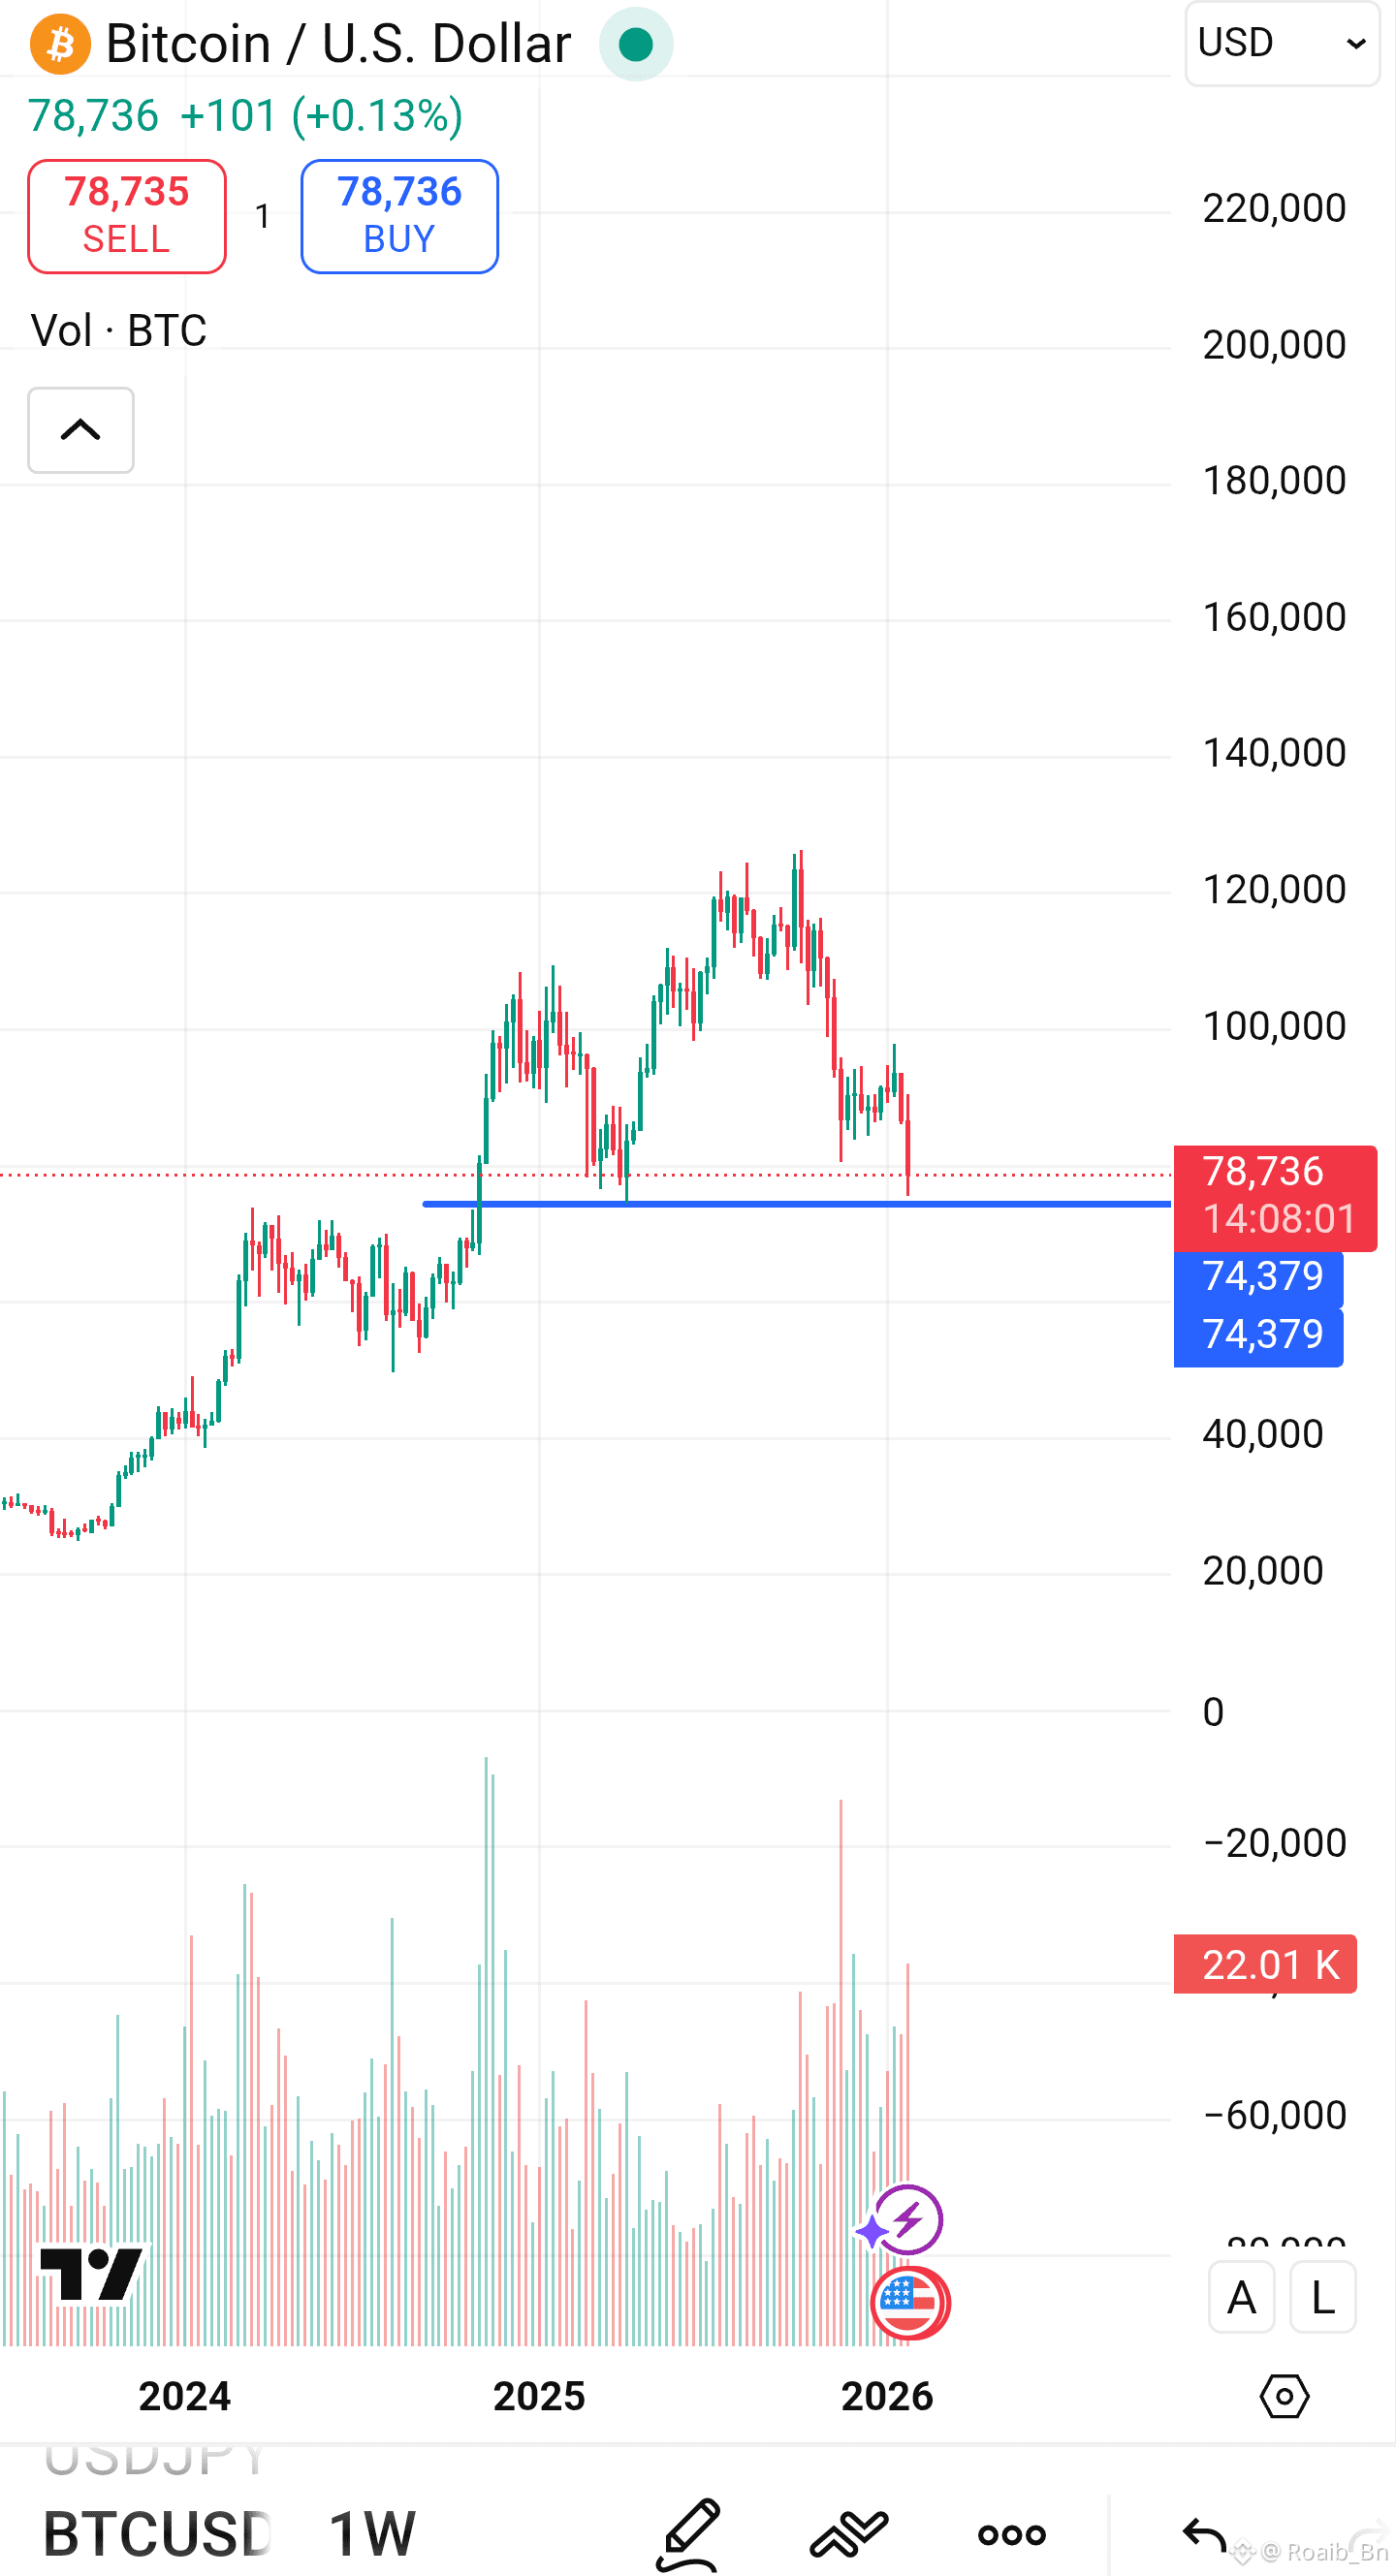
This zone previously acted as resistance before the breakout, and markets often retest these areas before the next major move.
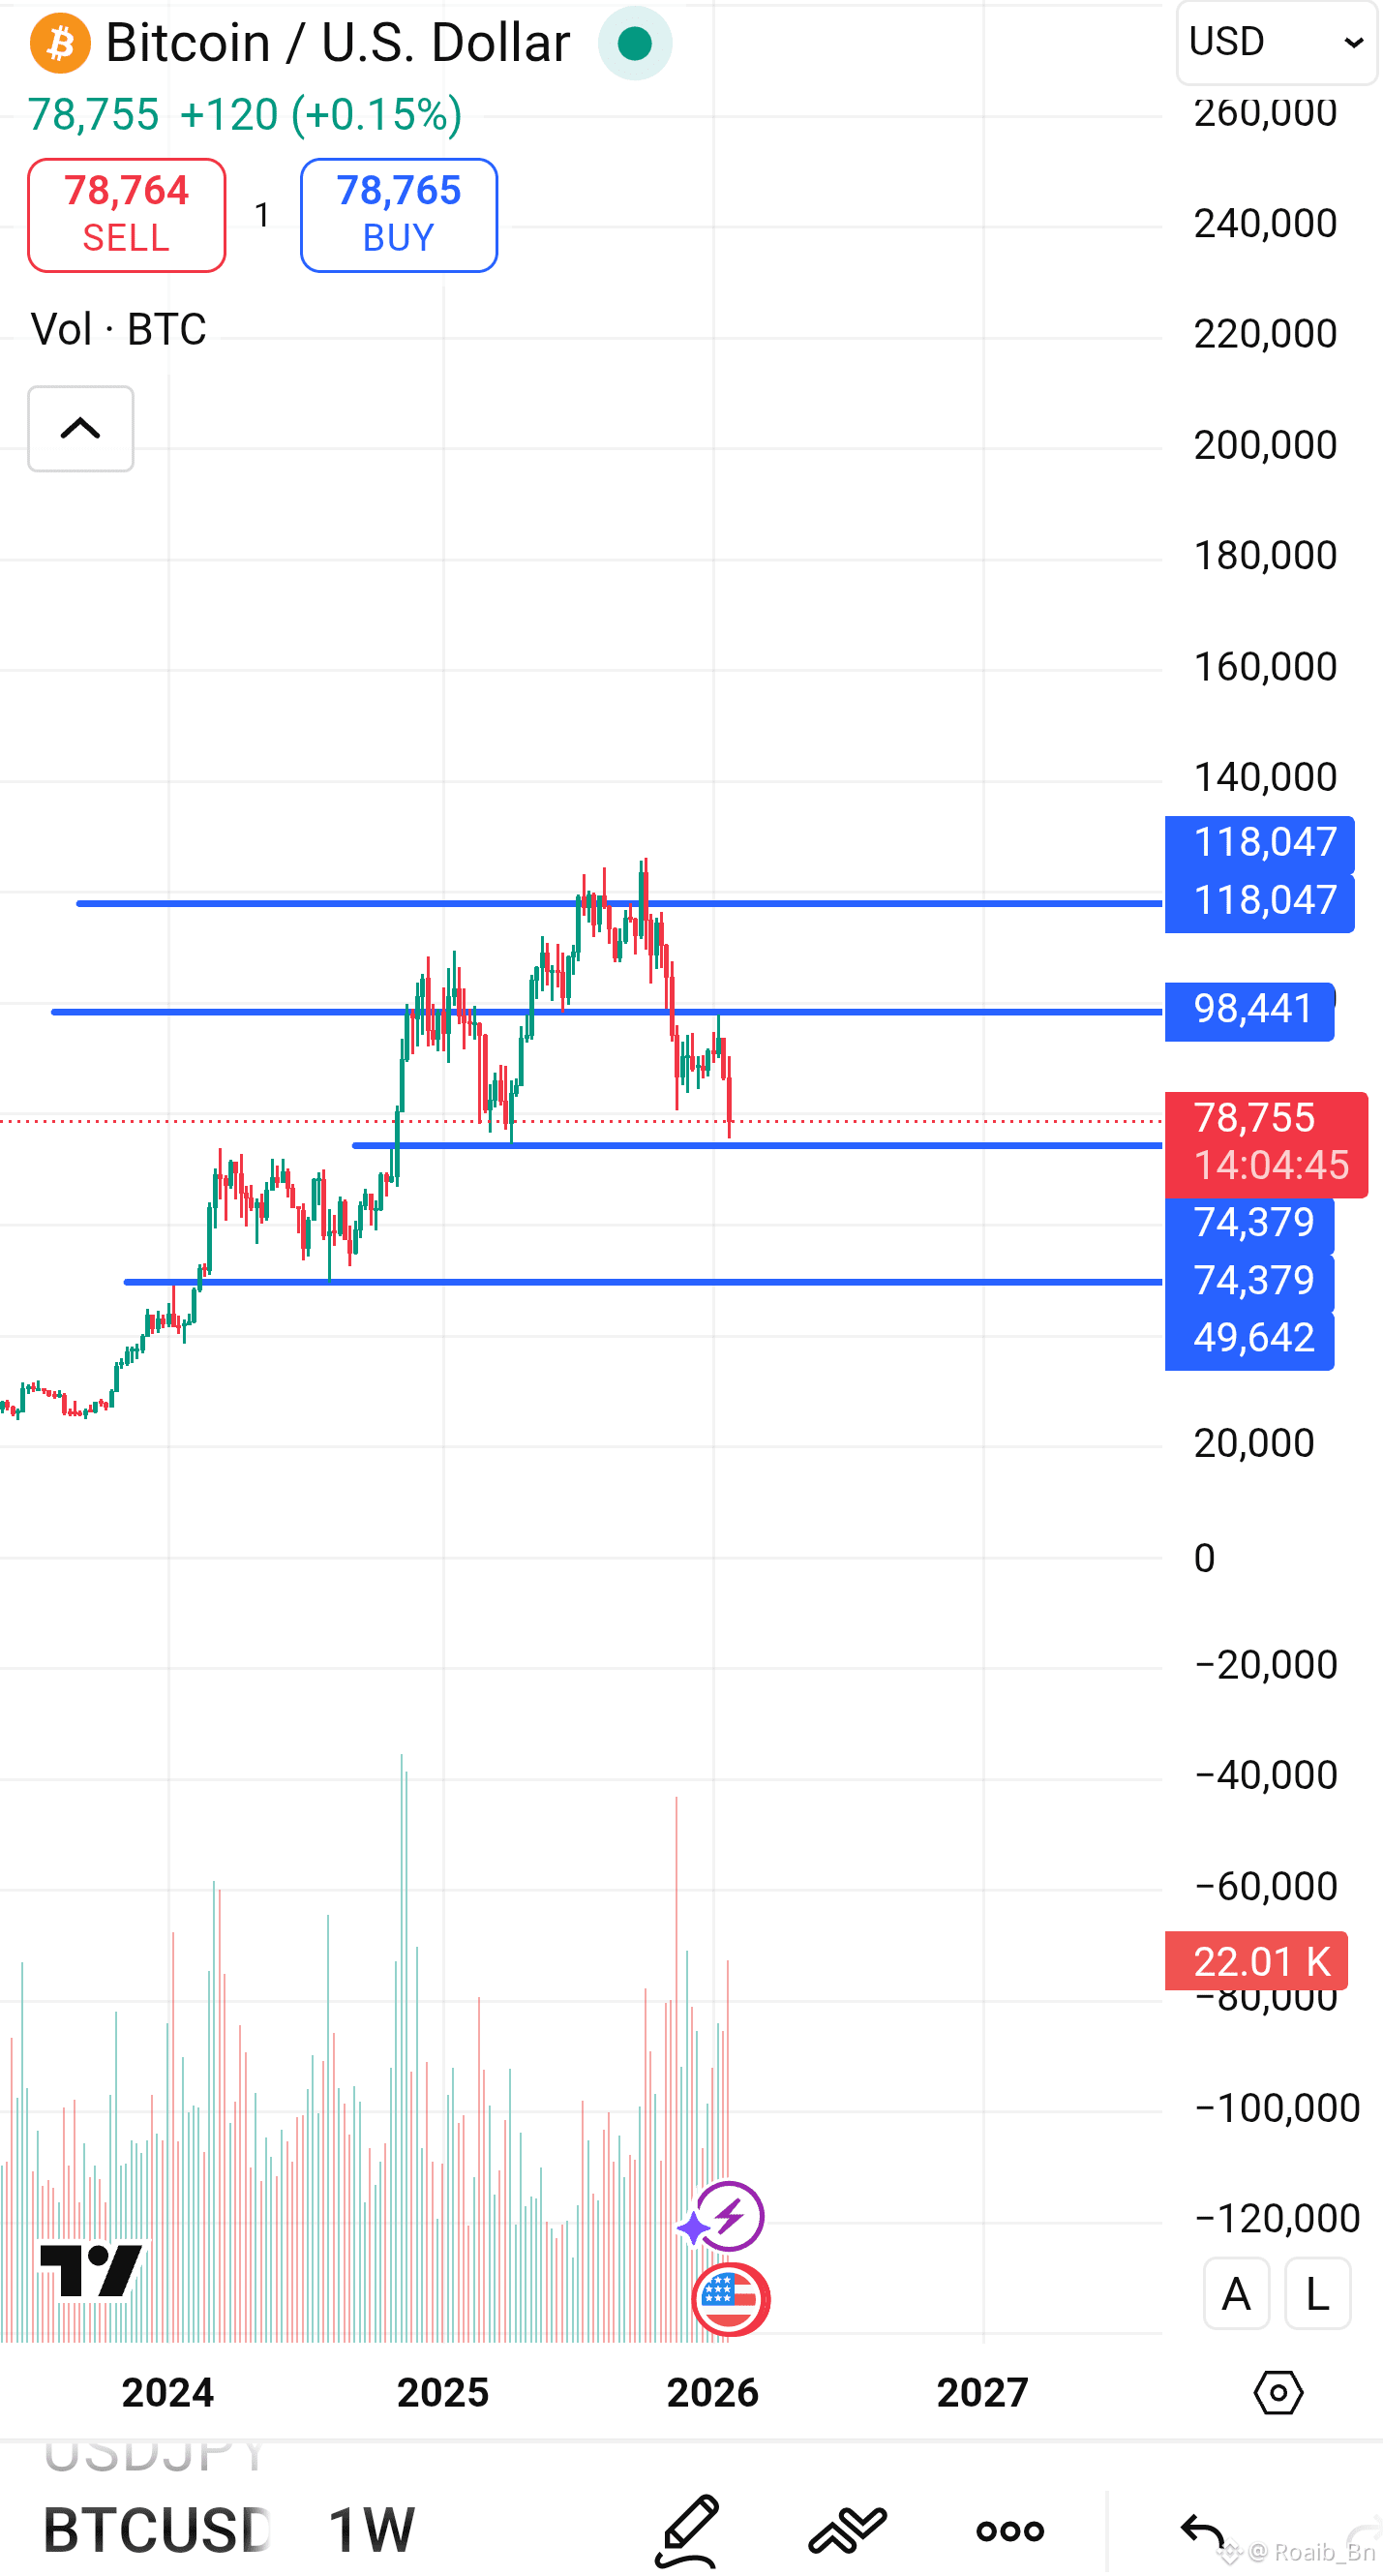
🔵 Key Levels to Watch
Major Support Zone
$74,000 – $75,000
Price is currently reacting here
This level previously triggered a strong bullish breakout
Buyers may step in again if confidence returns
Lower Support
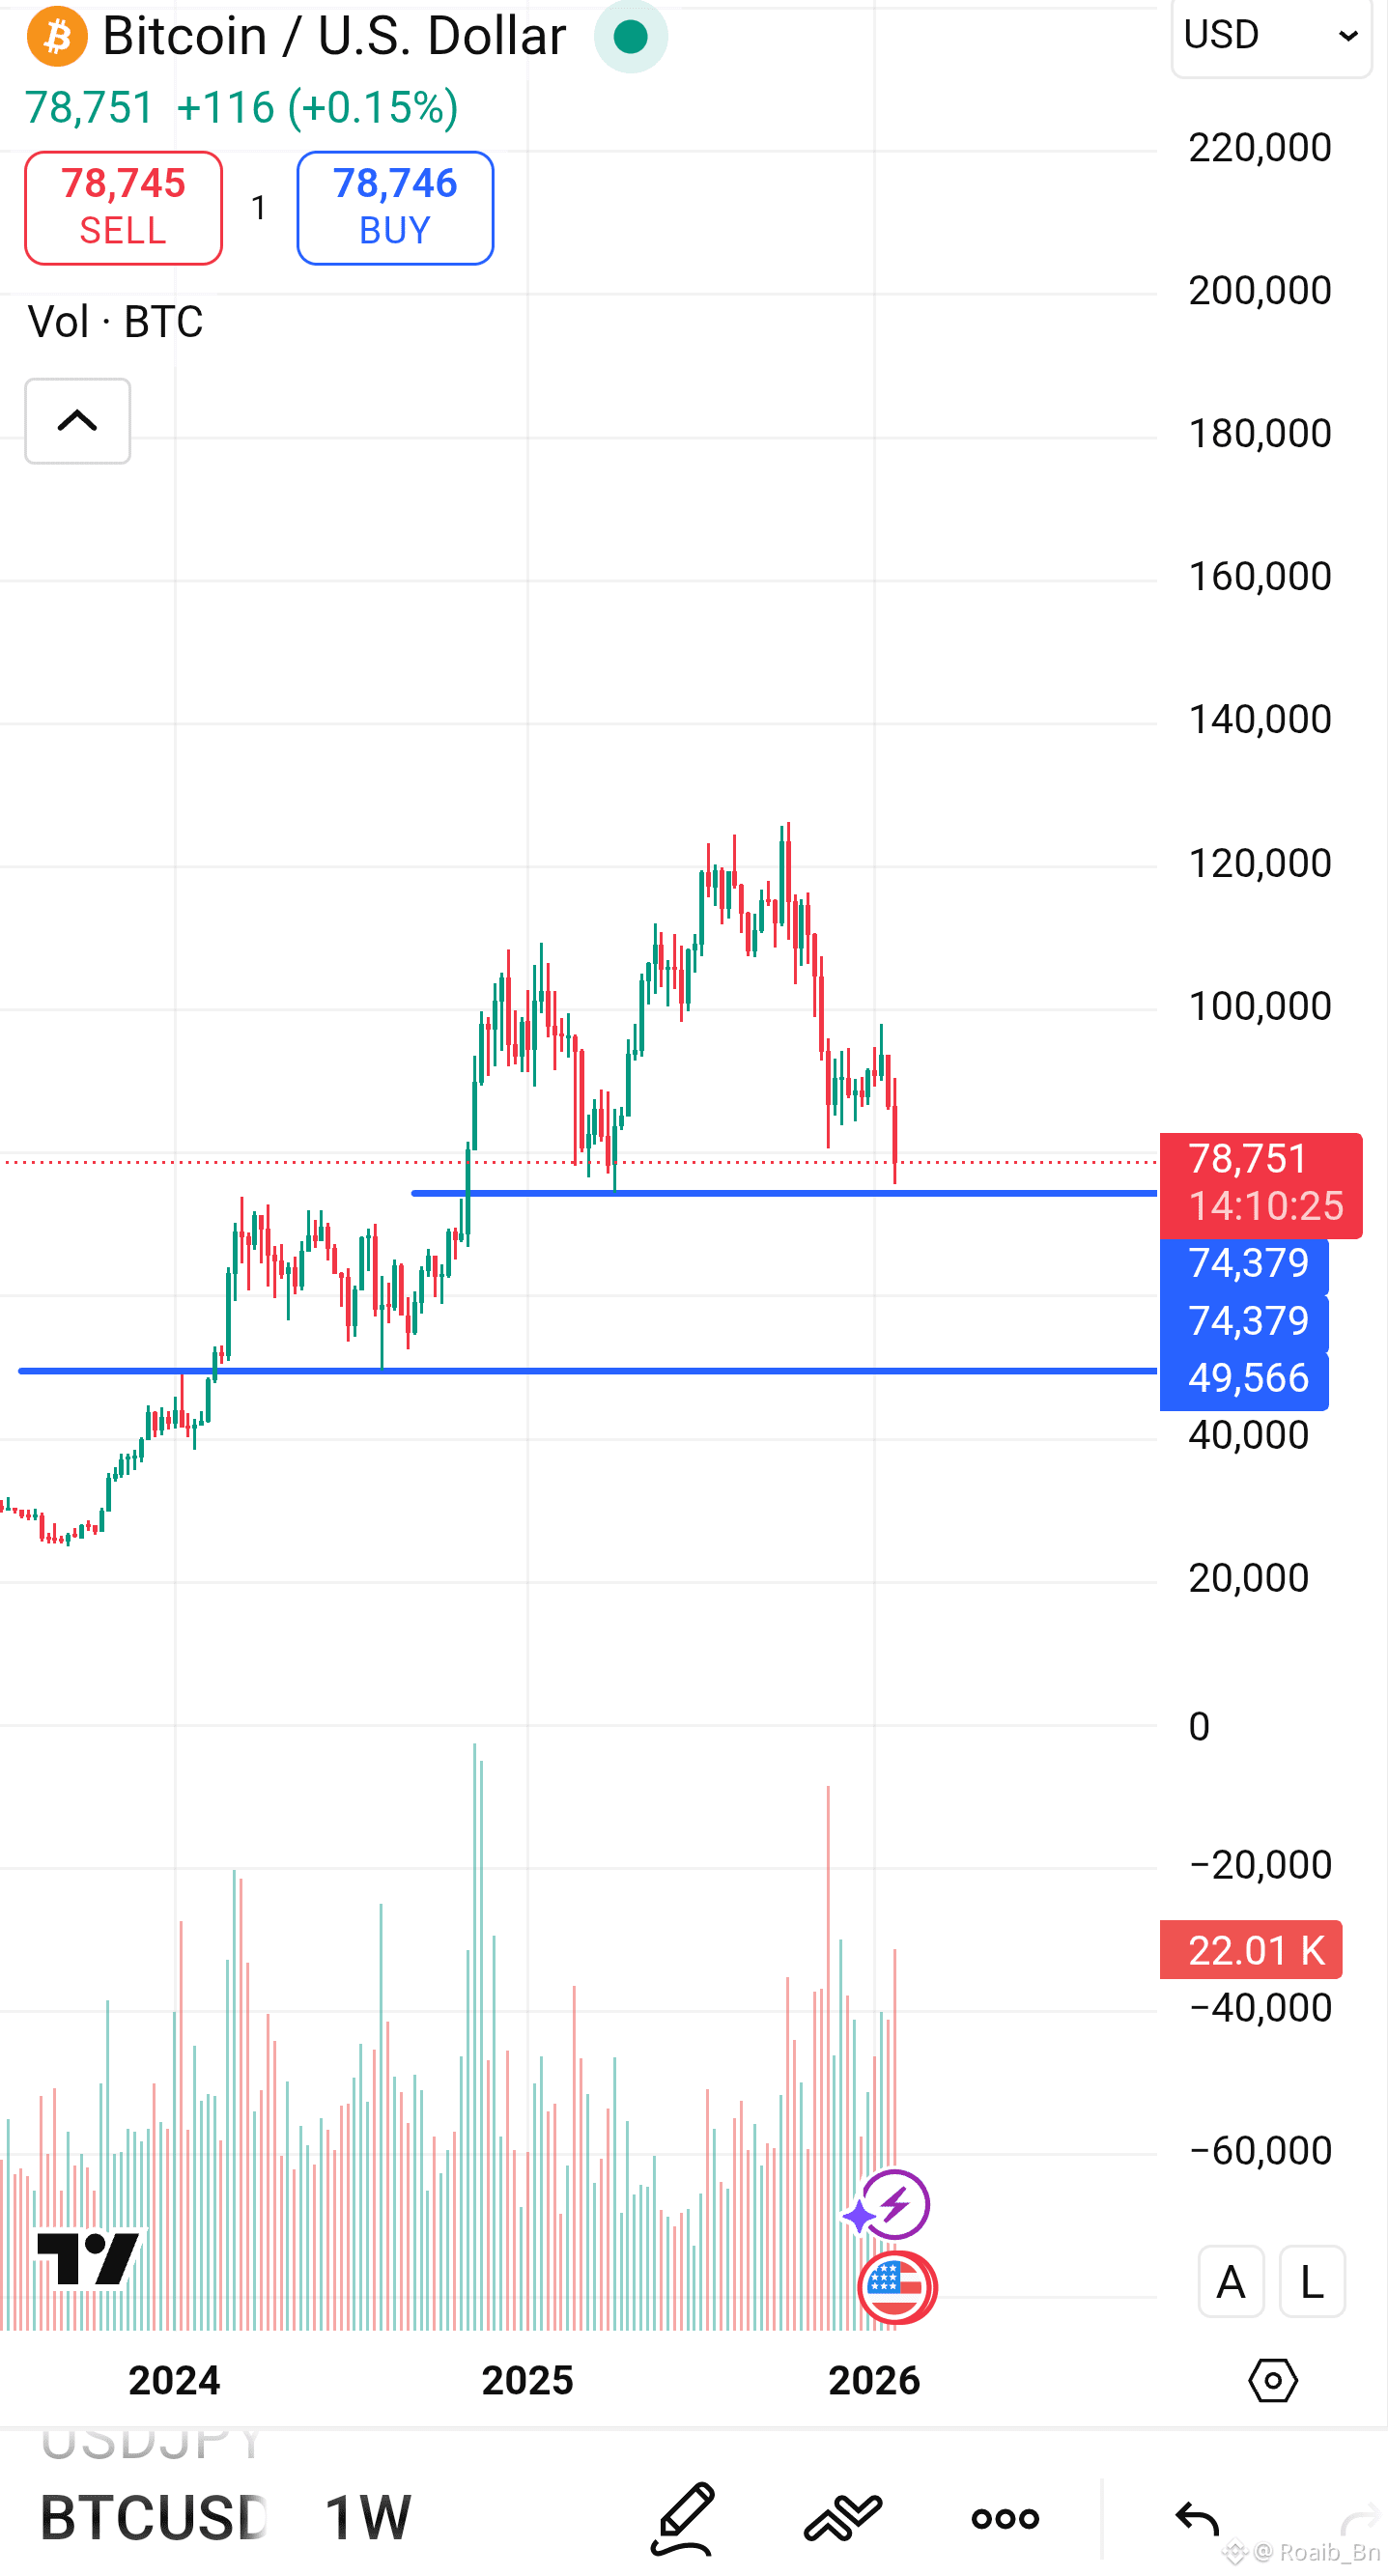
$49,000 – $50,000
If the current support fails, this becomes the next major historical demand zone
A move here would signal a deeper market correction
Resistance Levels
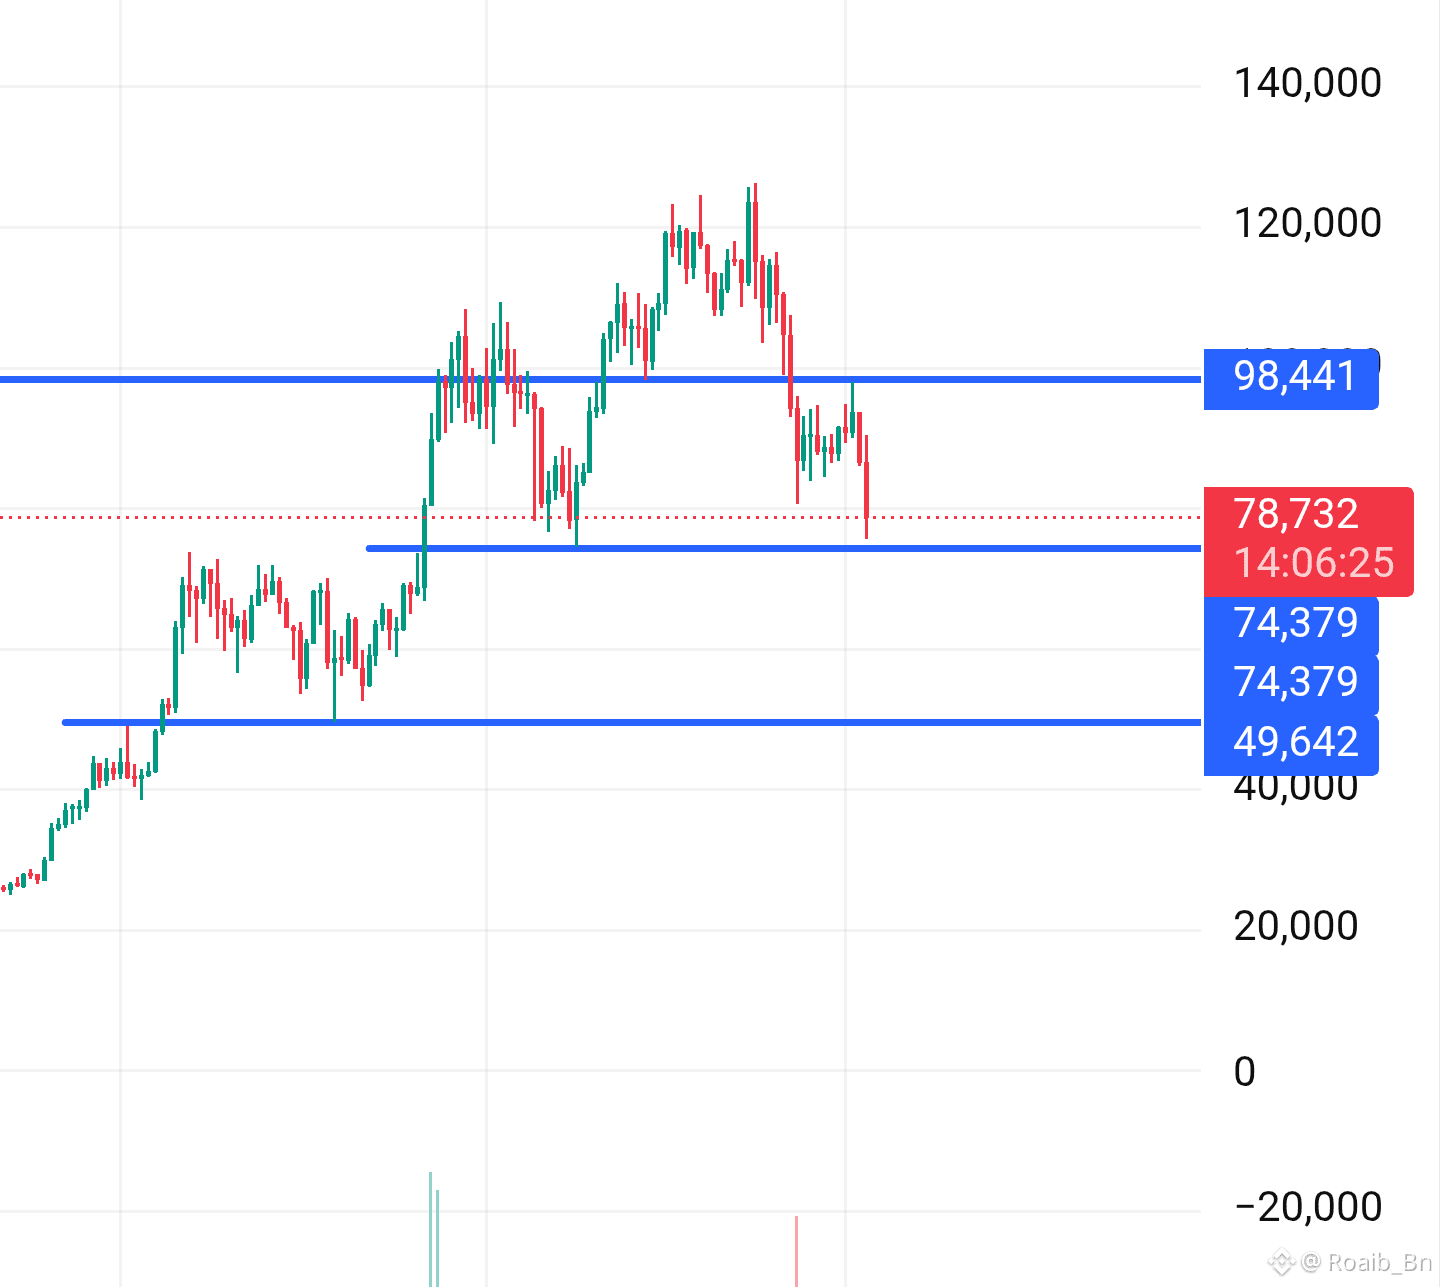
$90,000 – $100,000
First major recovery barrier
Previously acted as a consolidation and rejection area
$115,000 – $120,000
Prior peak region
A break above this would likely restart a strong bullish expansion
📈 Bullish Scenario
If BTC holds above the $74K support and volume increases:
Buyers could push price back toward $90K
A break above $100K may open the path toward new highs
This would suggest the current move is just a healthy correction in a larger bull cycle
Momentum confirmation signs:
Strong weekly close above $82K–$85K
Increasing green volume
Higher lows forming on lower timeframes
📉 Bearish Scenario
If BTC loses the $74K support with strong selling volume:
Price may drop toward $60K as an intermediate reaction level
Major downside target sits near $50K demand zone
That would shift the structure from bullish correction to deeper macro retracement
Bearish confirmation signs:
Weekly close below $74K
Rising red volume
Weak bounces with lower highs
🎯 Possible Trade Planning (Educational Example)
Bullish Idea (Support Bounce)
Entry: $75K–$78K zone
Stop Loss: Below $72K
Targets: $90K → $100K → $115K
Bearish Idea (Support Breakdown)
Entry: Confirmed weekly close below $74K
Stop Loss: Above $80K
Targets: $60K → $50K
Volume Insight
Recent spikes in volume show strong activity during the drop, meaning both profit-taking and new positioning are happening. The next big move will likely come with another volume expansion, not low-volume drifting.
Bitcoin is sitting at a make or-break level. This area often decides whether the market continues the broader bull trend or enters a deeper correction phase. Patience is key —confirmation matters more than prediction.
This is a high-volatility zone where fakeouts are common. Risk management is more important than being right.
Disclaimer: This is not financial advice. Always Do Your Own Research (DYOR) before making any trading decisions.

#CZAMAonBinanceSquare #USPPIJump #BitcoinETFWatch #USGovShutdown #WhoIsNextFedChair