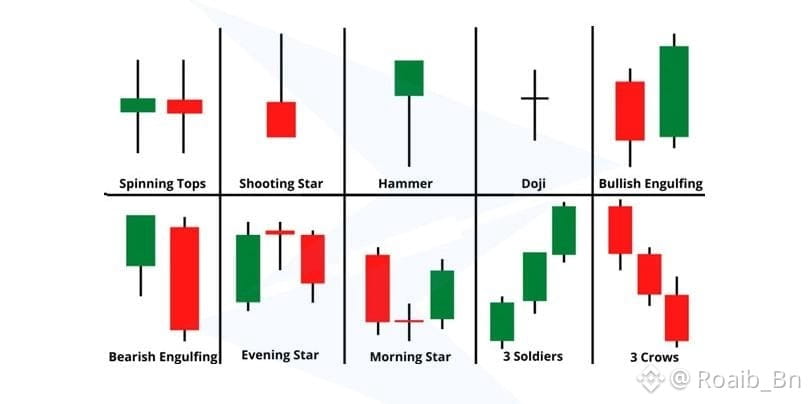
1. Spinning Top
What it looks like: Small body with long upper and lower wicks
Meaning: Market indecision
Buyers pushed price up, sellers pushed it down, and neither side won.
Often appears before a trend pause or possible reversal, especially after a strong move.
2. Shooting Star
What it looks like: Small body at the bottom with a long upper wick
Where it appears: At the top of an uptrend
Buyers tried to push higher, but sellers slammed price back down.
Bearish reversal signal if confirmed by the next red candle.
3. Hammer
What it looks like: Small body at the top with a long lower wick
Where it appears: At the bottom of a downtrend
Sellers pushed price down, but buyers stepped in strongly and brought it back up.
Often signals a bullish reversal.
4. Doji
What it looks like: Open and close are nearly the same
Meaning: Pure indecision
Neither bulls nor bears are in control.
A Doji after a strong trend can warn of a possible reversal.
5. Bullish Engulfing
Structure: Small red candle followed by a larger green candle that fully covers it
Buyers completely overpower the previous selling pressure.
Strong bullish reversal signal, especially after a downtrend.
6. Bearish Engulfing
Structure: Small green candle followed by a larger red candle that fully covers it
Sellers take full control from buyers.
Strong bearish reversal signal at the top of an uptrend.
7. Morning Star
Structure:
Strong red candle
Small indecision candle
Strong green candle
Represents a shift from selling pressure to buying control.
A classic bullish reversal pattern at market bottoms.
8. Evening Star
Structure:
Strong green candle
Small indecision candle
Strong red candle
Shows buyers losing strength and sellers taking over.
A reliable bearish reversal at market tops.
Trend Strength Patterns
9. Three White Soldiers
Structure: Three strong green candles in a row with higher closes
Buyers are in full control with steady momentum.
Signals a strong bullish trend continuation or reversal from bottom.
10. Three Black Crows
Structure: Three strong red candles in a row with lower closes
Consistent and aggressive selling pressure.
Indicates a strong bearish move or reversal from the top.
Here is the candles pattern image👇
If you found this helpful then please follow like and comment on it thanks 👍
#CZAMAonBinanceSquare #USPPIJump #BitcoinETFWatch #USGovShutdown #WhoIsNextFedChair