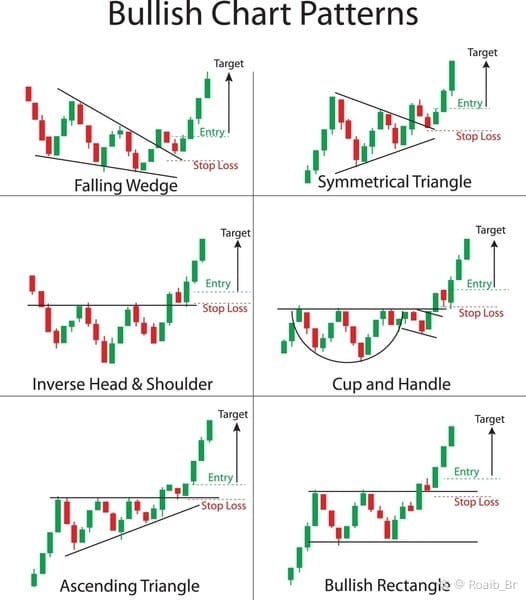
1. Falling Wedge
Price moves downward between two converging trendlines.
Indicates weakening selling pressure and potential bullish breakout.
Entry is taken after upside breakout with stop loss below support.
2. Symmetrical Triangle
Price forms higher lows and lower highs creating a triangle shape.
Represents consolidation before a strong breakout.
Bullish when price breaks above resistance trendline.
3. Inverse Head and Shoulders
Consists of three troughs: left shoulder, head (lowest), and right shoulder.
Signals strong trend reversal from bearish to bullish.
Breakout above neckline confirms buying opportunity.
4. Cup and Handle
Cup shows rounded bottom followed by small consolidation (handle).
Indicates accumulation and bullish continuation.
Breakout above handle resistance gives entry signal.
5. Ascending Triangle
Flat resistance line with rising support trendline.
Shows buyers becoming more aggressive.
Bullish breakout occurs above resistance zone.
6. Bullish Rectangle
Price moves sideways between support and resistance.
Indicates consolidation before continuation upward.
Breakout above resistance confirms bullish trend.
Here is the chart image👇
If you found this helpful then please follow like and comment on it thanks 👍
#WhenWillBTCRebound #PreciousMetalsTurbulence #MarketCorrection #CZAMAonBinanceSquare #USPPIJump