📉 What the Chart Shows (Technical Structure)
From the 30-min snapshot you provided:
1. Downtrend Structure
Lower highs & lower lows over multiple bars.
Price is below the 7, 25, and 99 moving averages.
The 99-period MA slopes downward — a bearish long-term slope even on this short timeframe.
Implication: Sellers are in control in the short term.
2. Volume Behavior
A big red volume spike during the drop indicates capitulation or strong selling pressure.
The following bars show diminishing volume as price consolidates to the downside.
Implication: Large sellers may have exhausted some supply, which can be a short-term bottom signal — but only if confirmed by stronger demand later.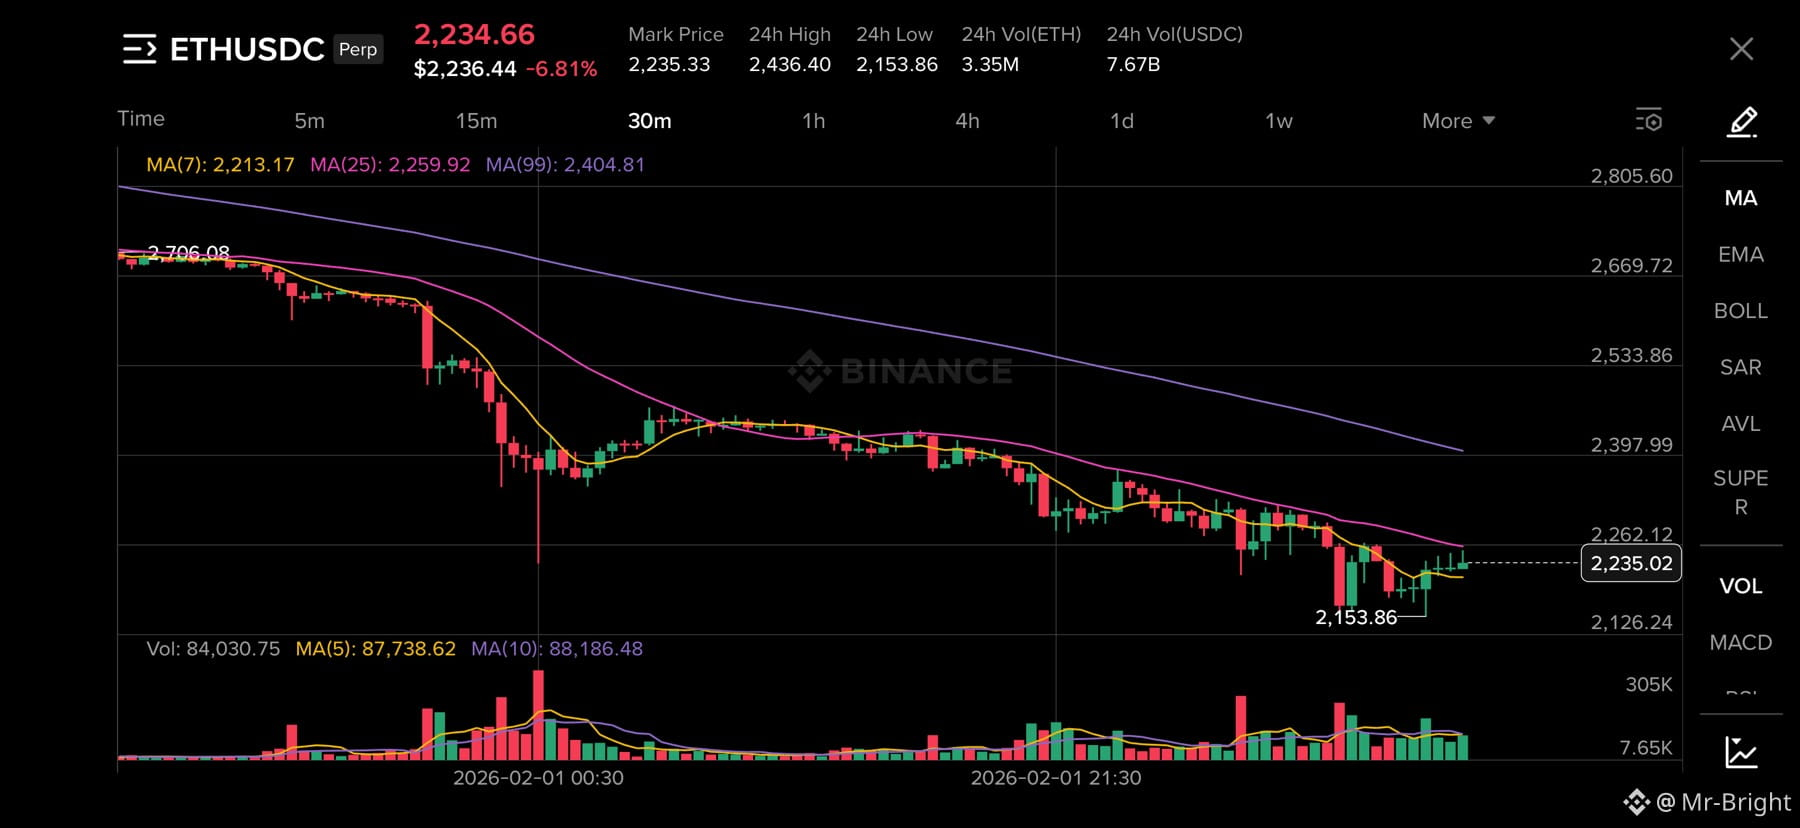
3. Recent Action
A small bounce from ~2,153 support.
Price has made a few green candles but still stuck under the 25 MA.
MAs are stacked: MA(7) below MA(25), both below MA(99).
Implication: Bulls attempted a recovery, but momentum remains weak.
📊 Technical Bias (Short-Term)
Current Probability Bias (based solely on the chart):
➡️ Bearish to Neutral
Bearish if price fails at the 25 MA and makes a new lower low.
Neutral (possible bounce) if price convincingly breaks above MA(25) with rising volume — but MA(99) overhead remains a resistance.
🧠 Market Rules & U.S. Macro Considerations
Cryptocurrency futures in the U.S. do not have a central regulatory rate like the Fed Funds Rate, but broader macroeconomic forces matter:
Federal Reserve & Interest Rates
When the Federal Reserve raises rates → risk assets (including crypto) often face selling pressure as yields elsewhere rise.
When the Fed cuts rates → risk assets can rally due to cheaper capital.
📌 The expectation of rate moves matters more than the actual events.
If the market is currently pricing higher rates for longer, that’s typically bearish for cryptos.
U.S. Regulatory Climate
Enforcement actions, legal uncertainty, or tighter rules from the SEC/CFTC tend to weigh on prices.
Positive rulings or clearer regulations tend to uplift sentiment.
Pending regulations around custody, futures clearing, and institutional access can move markets.
These drivers are macro and sentiment-based — not visible on your 30-min chart but extremely relevant.
📈 Signals That Would Favor an Upside Move
Bullish confirmation would come from:
✔️ Price breaking above the 25 and then 99 MA
✔️ Rising volume on green candles
✔️ Higher highs and higher lows on shorter timeframes
✔️ Broader market sentiment improving (e.g., risk appetite, BTC strength)
📉 Signals That Would Favor a Downside Move
Bearish continuation would come from:
✔️ Rejection at MA(25) and MA(99)
✔️ Fresh lower lows below ~2,153
✔️ Increased red volume
✔️ Negative macro news (Fed hawkish, regulation)
🧩 Putting It All Together $ETH
Factor
Current Stay
Impact
Trend (30m)
Downwards
Bearish
Volume
Spike then tapering
Potential end of selling, but weak demand
MA Positioning
Price below all major MAs
Bearish bias
Macro / Fed
Depends on data
If hawkish → bearish; if dovish → could support bulls
Regulatory Climate
Uncertain
Often weighs on sentiment
Net Breitling Summary:
➡️ Slightly higher probability of continuation downward unless buyers gain conviction and break immediate moving average resistance.
📌 Key Levels to Watch
Support: ~2,153 (recent low)
Resistance #1: ~MA(25) near current level
Resistance #2: MA(99) above
A break and hold above resistance with volume is the clearest short-term bullish signal. A break below support with renewed volume points to further downside.
🧠 General Market Rules to Remember
Trend is your friend until it isn’t. Short-term trends often persist.
Volume precedes price. Rising volume confirms moves.
Higher timeframes dominate. A break on a 4H or daily chart carries more weight than 30m.
Macro matters. Fed policy and risk sentiment bleed into crypto futures.


