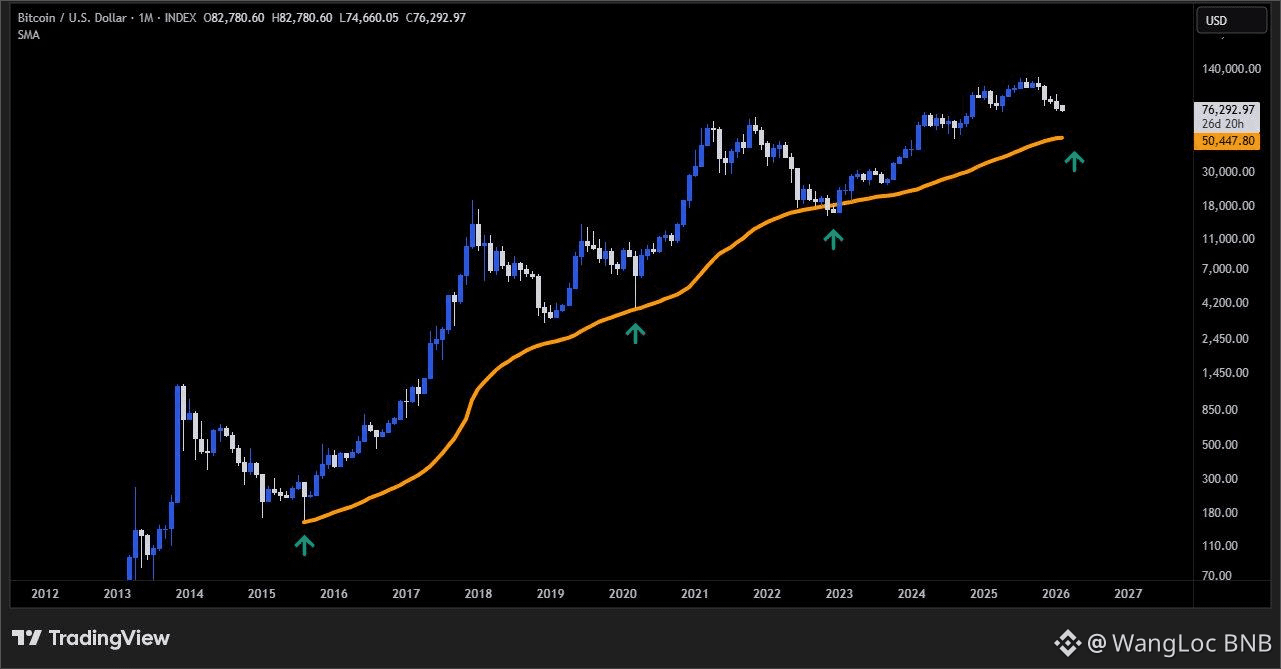
One of the most overlooked but historically powerful indicators in Bitcoin’s market structure is approaching again: the 300-week Simple Moving Average, currently sitting around $50,000.

This level is not just another moving average.
It has repeatedly acted as a cycle-level inflection zone a point where long-term risk compresses and asymmetric opportunities begin to form.
Why the 300W SMA matters
On the Weekly timeframe, the 300W SMA represents:
Deep-cycle mean reversion
Institutional cost-basis anchoring
Long-term liquidity absorption zones
Historically:
BTC rarely trades below this level for long
When price approaches it during high fear, volatility tends to compress before a decisive expansion
This is not a “buy signal.” This is a context signal telling us where the market is structurally vulnerable to a regime shift.
Bitcoin is now approaching this level while:
HTF structure is under pressure but not fully broken
Sentiment is heavily skewed bearish
Liquidations have already cleared excessive leverage
Confidence is collapsing faster than price
That combination matters. Markets do not bottom when optimism returns.
They bottom when selling becomes exhausted near long-term structural references.
The critical question is not whether price tags $50K. It’s how price behaves around the 300W SMA:
Fast rejection → confirms it as a demand magnet
Slow grind → signals absorption and balance
Sustained acceptance below → would be historically abnormal and require macro confirmation
Until that data prints, this is a zone for observation, not emotion. Every cycle has a level that feels “too obvious” in hindsight. The 300-week SMA has been that level more than once.
Ignore it if you want. But historically, this line has never been irrelevant.
#BTCanalysis #Marketstructure #CryptoMacro #BinanceSquare