## 📈 **Why $QKC Price is Pumping? | Full Analysis**
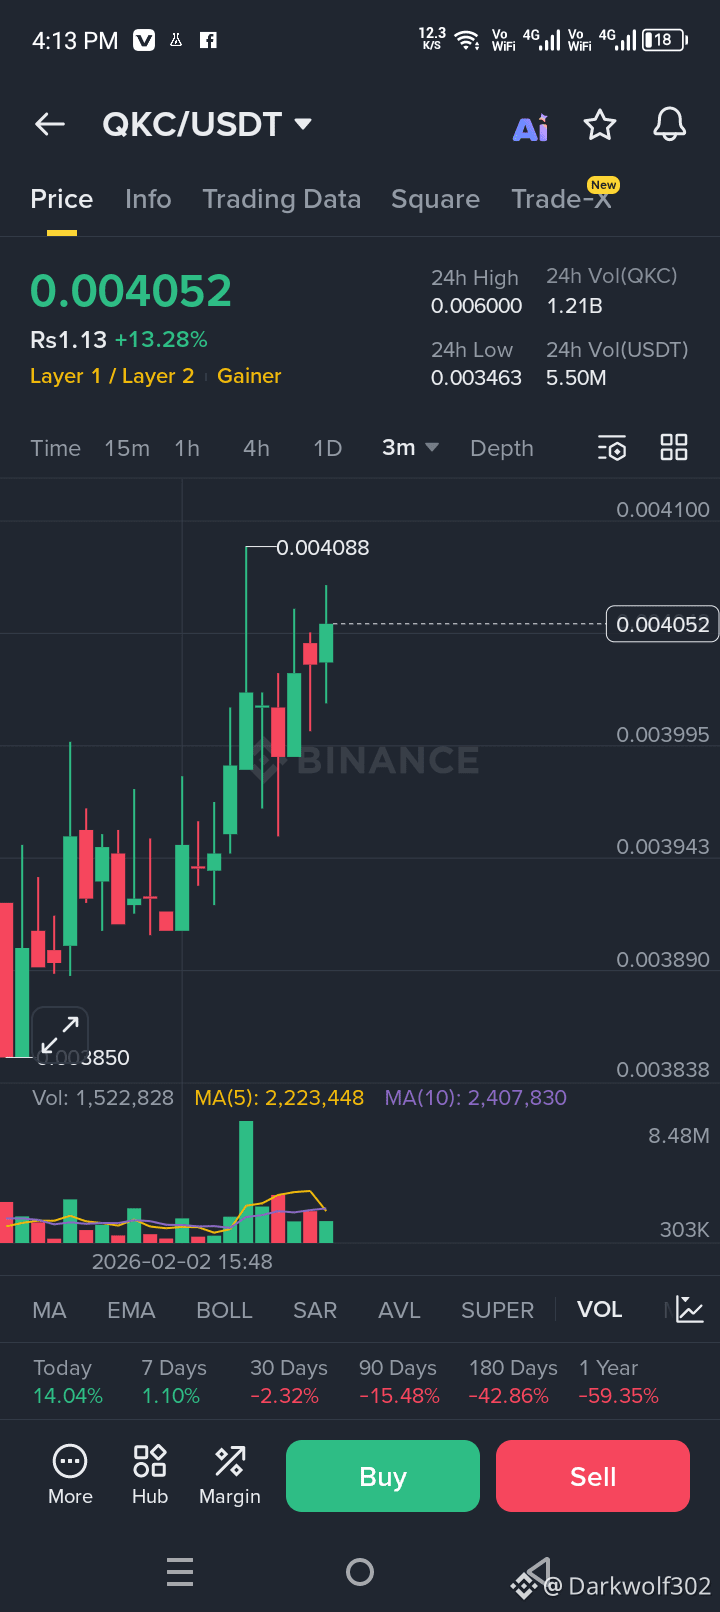
$QKC (QuarkChain) is showing a strong bullish move, currently trading near **0.00405 USDT** with more than **+13% daily growth**, which signals renewed buying interest and short-term momentum.
### 🔹 1) Strong Technical Breakout
On the 3-minute chart, QKC has **broken above previous resistance near 0.00390–0.00400**, which acted as a supply zone before. Once price crossed this level, buyers stepped in aggressively, triggering a breakout rally.
### 🔹 2) Higher Highs & Higher Lows (Uptrend Confirmed)
The chart shows a clear **higher-high and higher-low structure**, which is a classic sign of an emerging uptrend. This confirms that bulls are currently in control of short-term price action.
### 🔹 3) Volume Expansion = Real Buying Pressure
Volume has increased significantly (over 1.5M+), and MA(5) & MA(10) on volume are rising. This means the pump is supported by **real market participation**, not just fake wicks or low-liquidity spikes.
### 🔹 4) Break of Psychological Level (0.0040)
The **0.0040 zone** is a psychological resistance. Once QKC closed above it, many traders entered FOMO buys, which accelerated the upward movement.
### 🔹 5) Short-Term Momentum Trading
QKC is listed as **“Gainer”** on Binance, which attracts momentum traders and scalpers. These traders buy coins that are already moving fast, increasing volatility and pump strength.
### 🔹 6) Possible Short Squeeze
After long consolidation and weak performance (−59% yearly), many traders were short on QKC. When price moved up suddenly, stop-losses were triggered, forcing short sellers to buy back — creating extra upward pressure.
### 🔹 7) Oversold Recovery Bounce
Looking at long-term stats (90D, 180D, 1Y), QKC was heavily oversold. This pump looks like a **technical rebound** after prolonged bearish pressure.
### 🔹 8) Market Sentiment Shift
Layer-1 / Layer-2 narratives are gaining attention again, and QKC is categorized in this sector. This helps attract speculative inflows during altcoin rotation.
---
## 📊 Key Levels to Watch
### ✅ Support Zones
* 0.00390 – Strong intraday support
* 0.00375 – Breakdown risk level
### 🔴 Resistance Zones
* 0.00410 – Immediate resistance
* 0.00430 – Major short-term target
If price holds above **0.0040**, continuation is possible.
If it drops below **0.0039**, profit-taking may start.
---
## 📌 Candle Structure Analysis
Recent candles show:
✔ Long green bodies → Strong buyers
✔ Small lower wicks → Dip buying
✔ No major rejection yet → Trend intact
This indicates **healthy bullish momentum** for now.
---
## ⚠️ Risks & Caution
❗ QKC is still down heavily on higher timeframes
❗ This could be a short-term pump + pullback
❗ Profit-taking may start near 0.0041–0.0043
Traders should avoid chasing after big green candles.
---
## 🧠 Final Summary (For Binance Square)
QKC is pumping mainly due to a **technical breakout above resistance, rising volume, momentum trading, and short-squeeze effects**. The current structure favors bulls in the short term, but long-term trend is still recovering. Holding above 0.0040 is key for further upside, while rejection may lead to consolidation.
---
## ✍️ Ready-to-Post Version (Short)
**QKC Analysis 📈**
$QKC broke above 0.0040 with strong volume, confirming a short-term bullish breakout. Higher highs, rising volume, and momentum traders entering after “Gainer” listing are driving this move. A possible short squeeze and oversold rebound also support the pump. Support lies at 0.0039, while resistance is near 0.0042. Trend remains bullish short-term but caution is needed near ready
#WhenWillBTCRebound #MarketCorrection #USPPIJump