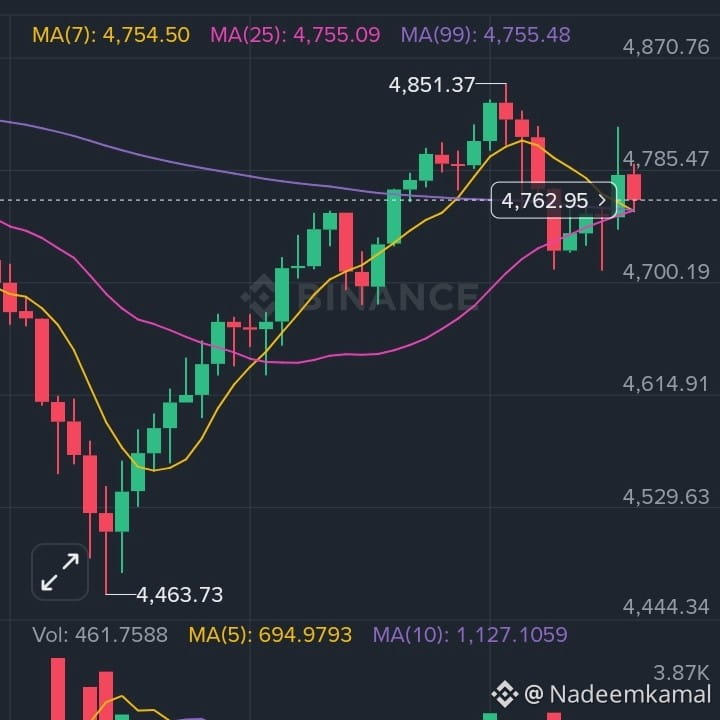
$PAXG recent bearish move after a strong bullish rally is not a sign of weakness in gold itself, but a classic case of market mechanics and trader psychology playing out. On the 15-minute chart, PAXG pushed aggressively from the 4,460 zone up to around 4,850, which was a clean impulse move driven by momentum traders and short covering. However, once price tapped the upper resistance area near previous highs, the rally started losing fuel. You can clearly see price failing to hold above the moving averages, with MA(25) and MA(99) clustering tightly. This clustering is important because it signals balance turning into compression. When bullish momentum slows near resistance, early buyers start securing profits, especially in an asset like PAXG where many traders treat rallies as opportunities to sell strength rather than chase breakouts. The rejection near 4,850 created long upper wicks, showing supply entering the market. As soon as price slipped back below short-term support, the shift from bullish continuation to bearish correction became inevitable.
Technical Confirmation: Momentum Weakness, Profit-Taking, and Mean Reversion.
The bearish follow-through becomes clearer when you look at momentum indicators. The MACD histogram has turned negative, and the DIF line is losing strength while staying below the signal line. That tells us bullish momentum has already peaked, even though price is trying to hold above 4,750. This is a classic bearish divergence-style behavior where momentum cools before price fully breaks down. Volume also supports this idea. The bullish leg up had relatively strong buying volume, but recent candles show declining participation, meaning fewer buyers are willing to push price higher at these levels. At the same time, PAXG is highly sensitive to gold price stability, the US dollar, and risk sentiment. When price moves too far too fast, the market naturally seeks equilibrium, pulling price back toward fair value zones like the MA(25) and MA(99). This does not mean PAXG is entering a long-term downtrend. It simply means the market is rotating from impulsive bullish movement into a corrective or consolidation phase. Unless price cleanly breaks and holds above the 4,850 resistance with strong volume, sellers will continue to defend this zone. In short, PAXG turned bearish after bullish because momentum exhausted near resistance, profit-taking kicked in, indicators confirmed slowing strength, and the market reverted to balance. Smart traders now wait for either a strong support hold or a confirmed breakdown before committing to the next direction.